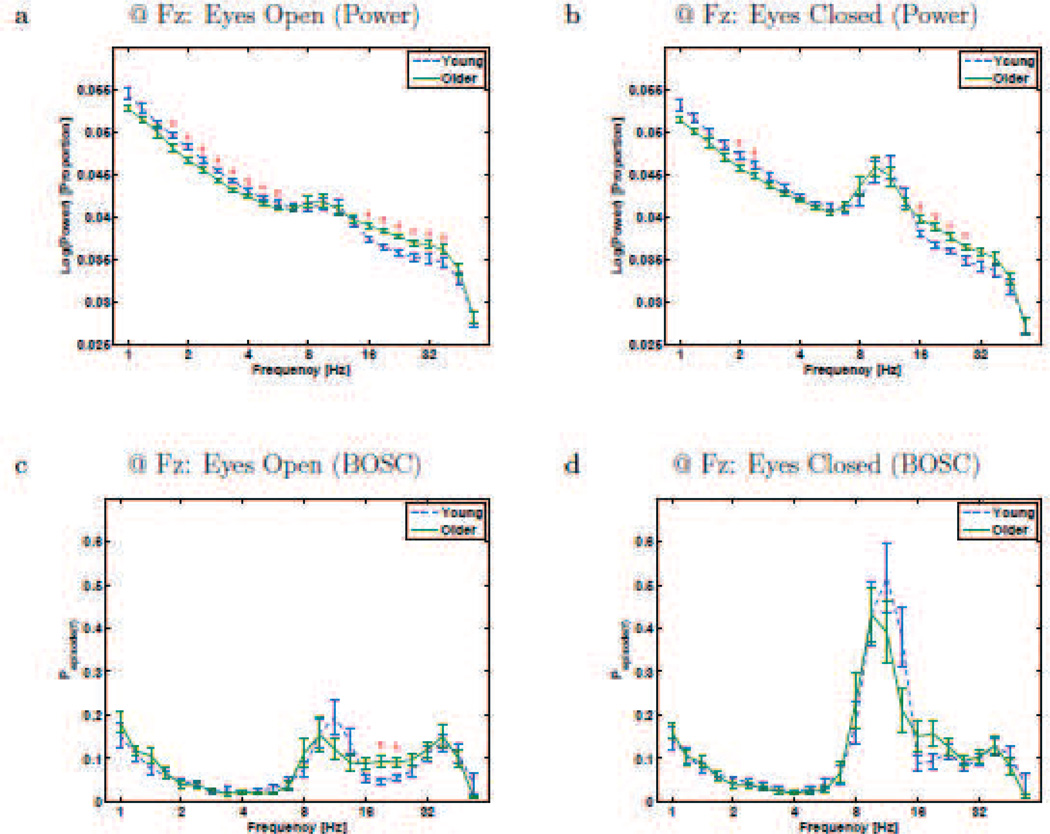
Figure 3.
Resting-state rhythms at Electrode Fz for Young and Older participants. a and b plot conventional power-analysis measure: wavelet power (log-transformed and then normalized by total log-power) as a function of frequency (also on a logarithmic scale). c and d plot the BOSC measure, Pepisode, or proportion of time occupied by oscillations at each frequency. Error bars are standard error of the mean. * - significant difference between Young and Older groups (Mann-Whitney U test, df = 26, p < 0.05, uncorrected).

