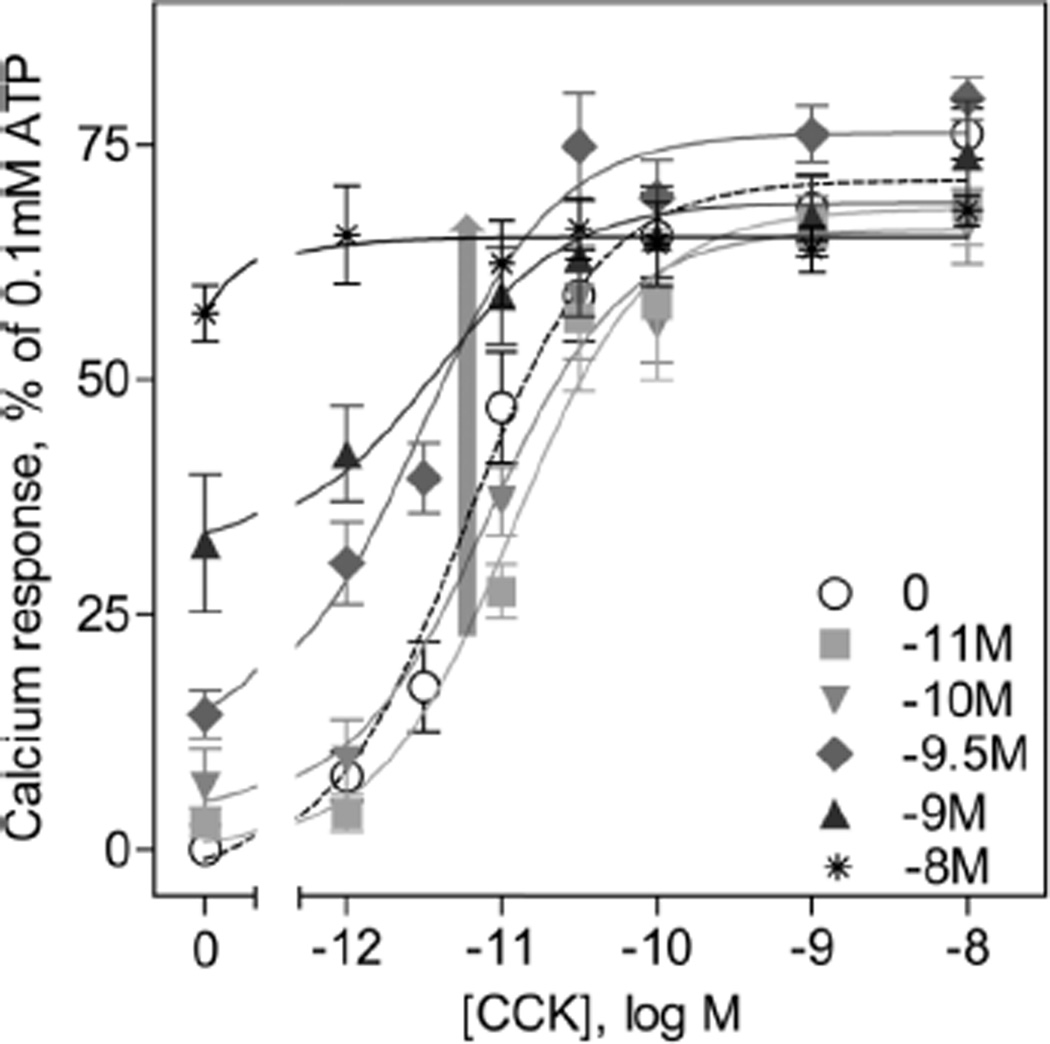
FIGURE 4.
Effect of increasing concentrations of GI181771X on CCK responses at the CCK1R. Shown are CCK-stimulated intracellular calcium dose-response curves on CHO-CCK1R cells in the absence or presence of increasing concentrations of GI181771X, with values expresses as percentages of the response to maximum stimulation achieved by 0.1mM ATP. The gray arrow indicates no significant change in the EC50 values of the CCK response curves, indicating no PAM activity of GI181771X. Data represent means ± S.E.M. from duplicate determinations from at least four independent experiments.

