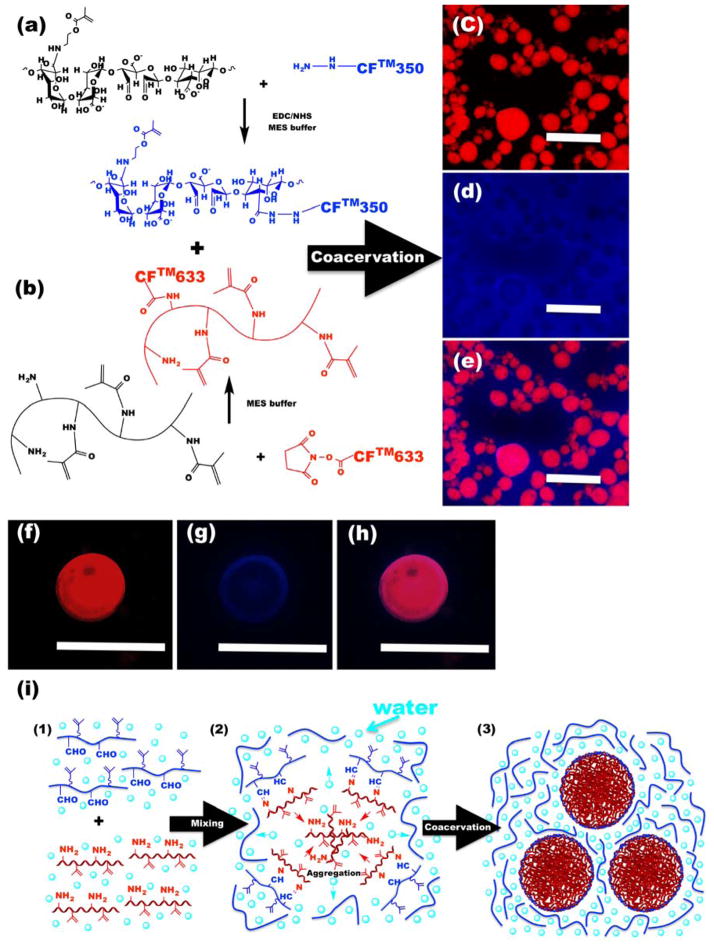
Figure 2. Microstructural characterization of OMA/GelMA coacervates.
(a–b), Schematic illustrations for synthesis of fluorescently-labeled (a) 17.5OX15MA and (b) H-GelMA-A. (c–e), Representative fluorescence photomicrographs of OMA/GelMA coacervates. (c) Red channel, (d) blue channel and (e) merged image. (f–h), Representative fluorescence photomicrographs of individual OMA/GelMA coacervate microdroplet with high magnification. (f) Red channel, (g) blue channel and (h) merged image. The scale bars indicate 50 μm. (i) Schematic representation of the formation of OMA/GelMA coacervate microdroplets.

