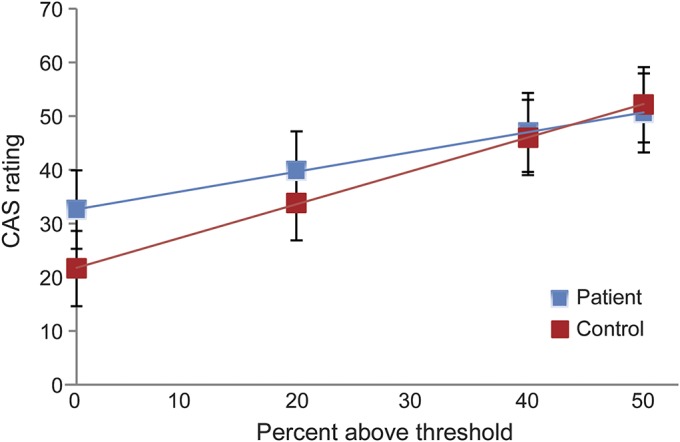
Figure 2. Stimulus-response curves for suprathreshold heat stimuli in patients and controls.

The horizontal axis indicates the percentage above the heat pain threshold (HPT), and the vertical axis the pain ratings (colored analog scale [CAS] [0–100 arbitrary units]; mean [95% confidence interval]) for patients (blue) and controls (red). Equations, describing the relations between stimulus and CAS ratings, are as follows: patients: CAS rating = 32.63 (standard error 4.27) + 0.36 (0.06) × percentage above threshold + 2.79 (0.74) × (HPT-40): controls: CAS rating = 21.66 (3.58) + 0.61 (0.07) × percentage above threshold + 2.79 (0.74) × (HPT-40).
