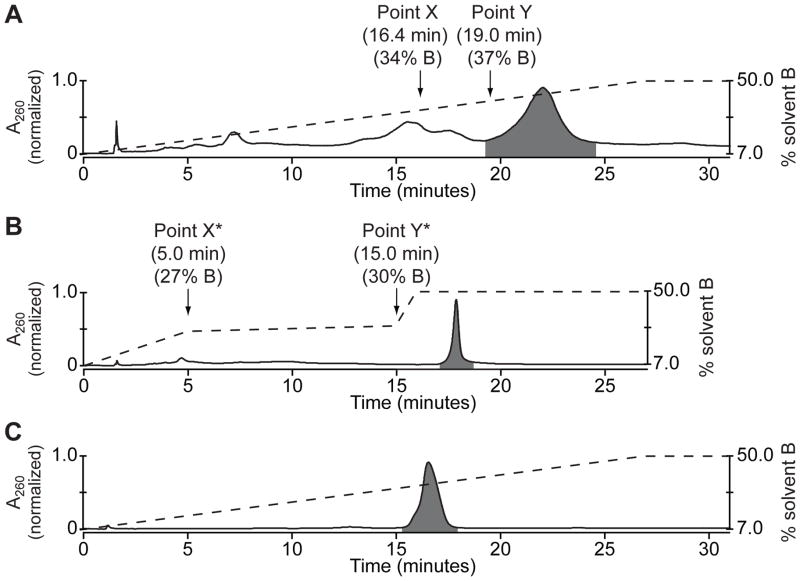
Figure 2. Purification of a cMO hairpin.
(A) Chromatogram of a crude cMO mixture separated by preparative ion-exchange HPLC using a continuous solvent gradient. MO oligomers eluted in order of increasing adenosine and thymidine content, with the cMO eluting last (highlighted in gray). The dashed line represents gradient composition (% solvent B), and the retention time and gradient composition associated with points X and Y are noted. (B) Chromatogram of the same crude cMO mixture separated by preparative ion-exchange HPLC using a step-wise solvent gradient and empirically derived transition points X* and Y*. The cMO eluted as a symmetric peak with a half-height temporal width of approximately 20 sec. (C) Chromatogram of the cMO isolated by the step-wise solvent gradient in (B) and analyzed by analytical ion-exchange HPLC using a continuous solvent gradient. The cMO purity was determined to be 98.8% and its molecular mass was confirmed by LCMS.

