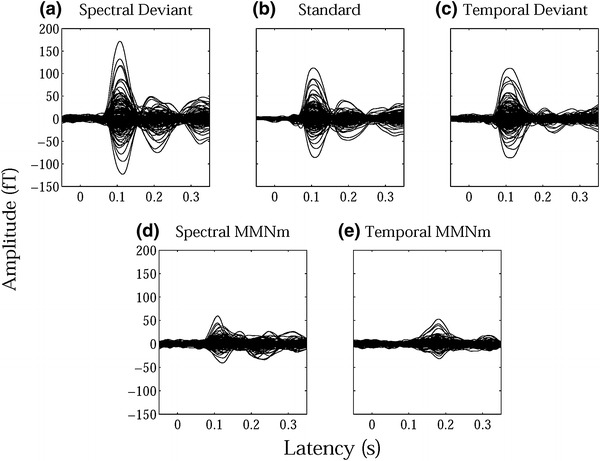
Fig. 2.

Examples of individual magnetic waveforms. The upper panels represent the auditory evoked fields of one representative subject elicited by a spectral deviant (SD), b standard, and c temporal deviant (TD) sound stimuli. The lower panels show the magnetic waveforms obtained by the subtraction between a and b [d spectral mismatch negativity (MMNm_SD)] and between c and b [e temporal mismatch negativity (MMNm_TD)]
