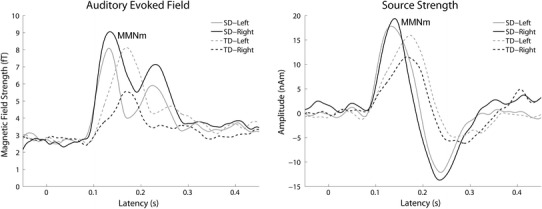
Fig. 3.

Grand-averaged (N = 12) root-mean-square (RMS) values of the magnetic fields (left panel) and grand-averaged source strengths (right panel) of the mismatch negativity (MMNm) waveforms. Solid and dashed lines represent the spectral deviant (MMNm_SD) and the temporal deviant (MMNm_TD) conditions, respectively. Gray lines represent the left sensor (left panel) and left hemisphere (right panel) and black lines represent the right sensor (left panel) and right hemisphere (right panel)
