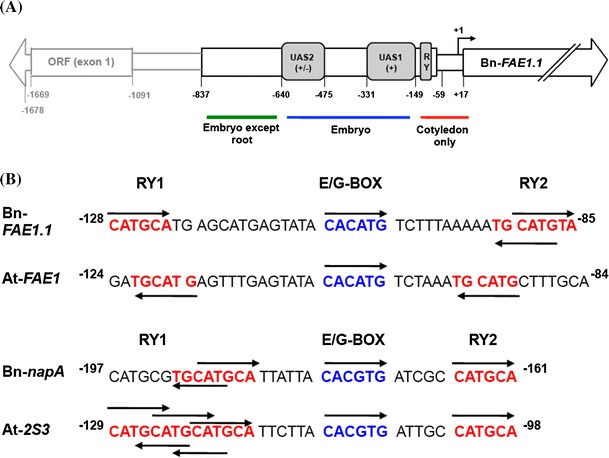
Fig. 7.

Structural organisation of the Bn-FAE1.1 promoter. a Regions containing cis-acting elements exerting control over level and tissue specific expression as defined by deletion analyses shown in Figs. 5 and 6. UAS indicates regions exerting control over level of expression of Bn-FAE1.1. The signs in parentheses indicate the quantitative effect of each domain on level of GUS reporter expression in the embryo tissues indicated. The domains of FAE1 expression in the embryo controlled by the corresponding promoter region are indicated under the figure. b Motifs associated with high level expression of FAE1 and 2S napin genes in cotyledons of B. napus and A. thaliana. Positions are indicated relative to start of translation. Arrows indicate position of motif on top or bottom strands of DNA
