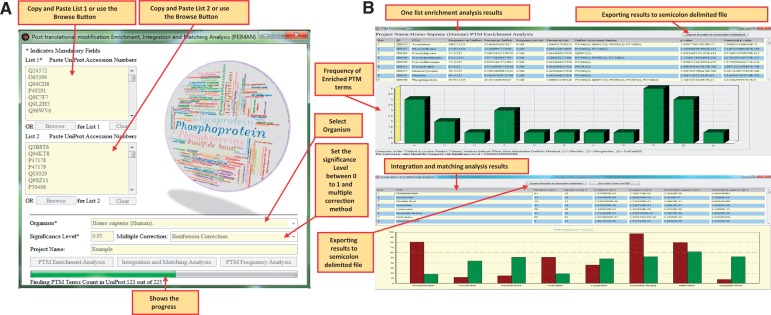
Figure 4.
The PEIMAN environment. (A) Input parameters in PEIMAN software. The fields with star sign indicates the mandatory input parameters in the software. (B) PEIMAN output. The figure demonstrates the output of PTM Enrichment analysis in software. A table and a bar chart are produced after the analysis is completed. The table provides the ID column for each PTM vocabulary. It also provides the frequency of each PTM vocabulary in UniProtKB and the corresponding frequency in protein list. The percent of each PTM vocabulary in UniProtKB and given list of protein is provided as well. The table shows which UniProtKB accession numbers in protein list have the corresponding PTM vocabularies. A P-value and corrected P-value (if multiple correction method is chosen) are provided for further analysis. A bar chart is provided to better represent the data. A comment about where more information is accessible about each protein (Database cross-reference—DR) is provided as well. The result of the integration and matching analysis are presented for two separate protein lists. The produced table and bar chart gives a better understanding about the PTM vocabularies found in two separate protein lists. The table provides the P-value, corrected P-value, frequency and percent of each PTM vocabulary in both lists.

