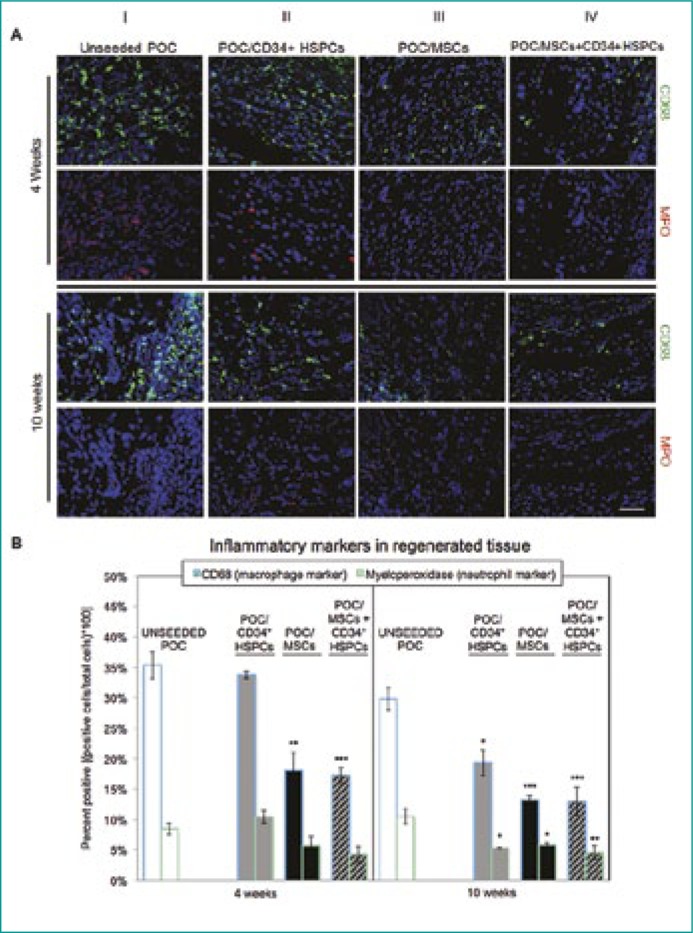
Figure 1.
Macrophage and neutrophil distribution in unseeded or cell seeded bladder augmented tissue samples.
(A) CD68+ macrophage (green) expression was highly abundant in uPOC and POC/CD34+ HSPCs grafts. The infiltrating macrophage population encompassed the entirety of the graft and was also evident at contact points where the suture traversed native bladder tissue into the POC. Similarly, MPO+ neutrophils (red) were also found to be in greater numbers in the aforementioned treatment groups. In contrast, POC/MSC and POC/MSC-CD34+ HSPC grafts displayed considerably lesser levels of both CD68+ macrophage and MPO+ neutrophils at both 4 and 10 weeks post-surgery. n = 10 images/animal. Blue = DAPI. Magnification, 400x. Scale bar, 50 µm.
(B) Quantification of CD68+ (left bars) and MPO+ (right bars) IF staining at 4 weeks (left panel) and 10 weeks (right panel). At 4 and 10 weeks post-augmentation, CD68+ cells comprised 35.4 ±2.2% and 29.8 ±1.9% of the regenerated tissue from unseeded grafts, with MPO+ levels (CD68+ and CD68-) of 8.5 ±1.0% and 10.5 ±1.2%. POC/MSC grafts, with or without CD34+ HSPCs, resulted in a significant decrease in the macrophage infiltrate (4 and 10 weeks) and in the neutrophil population (10 weeks) (4W: POC/MSC 18.1 ±2.9% CD68+, 5.7 ±1.5% MPO+ and POC/MSC + CD34+ HSPC 17.3 ±1.2% CD68+, 4.3 ±1.3% MPO +; 10W POC/MSC 13.2 ±0.7% CD68+, 5.8 ±0.3% MPO+ and POC/MSC+ CD34+ HSPCs 13.0 ±2.3% CD68+, 4.6 ±1.2% MPO+). POC/CD34+ HSPCs grafts showed a delayed effect, with reduced macrophage and neutrophil populations observed at 10 weeks (4W: 33.8 ±0.6% CD68+, 10.4 ±1.0% MPO+; 10W: 19.3 ±2.1% CD68+, 5.3 ±0.1% MPO+). Data shown as means ±SE. Significance shown for comparison of cell-seeded groups to uPOC; *P <0.05, **P <0.01, ***P ≤0.001, ****P <0.0001.

