Figure 2.
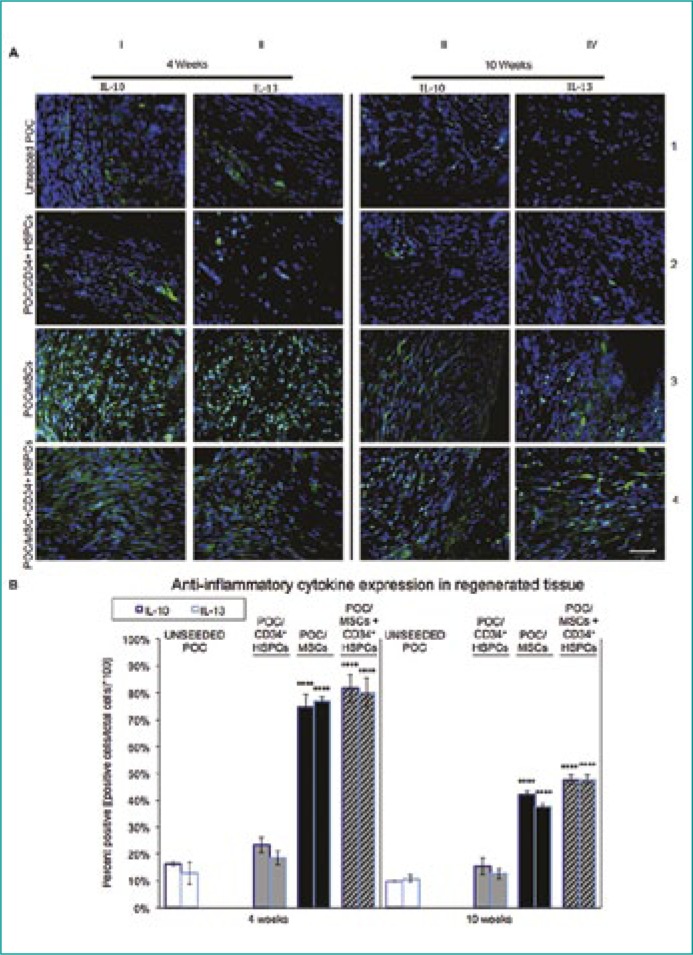
Anti-inflammatory IL-10 and IL-13 cytokine expression in regenerating bladder tissue.
(A) The cytokines IL-10 and IL-13 are known to possess anti-inflammatory properties and facilitate tissue regeneration throughout the remodeling phases of inflammation. At 4 weeks post-augmentation, both IL-10 (green) and IL-13 (green) expression is low in uPOC and POC/CD34+ HSPC grafts. This trend continued as seen at the 10 week time-point where the levels of expression decrease even further. Antithetical results are observed with POC/MSC and POC/MSC + CD34+ HSPC grafts. There is an approximate 4-fold increase in IL-10 and IL-13 cytokine expression at 4 weeks post-augmentation compared to the uPOC control. Although the levels of the anti-inflammatory cytokines decreased at the 10 week time-point, there were still significant levels of expression of both cytokines, again approximately 4-fold greater than uPOC control grafts. n = 10 images/animal. Blue = DAPI. Magnification, 400x. Scale bar, 50µm.
(B) Quantification of anti-inflammatory cytokine expression, shown as percentage of cells staining positive for IL-10 (left bars) and IL-13 (right bars) at 4 weeks (left panel) and 10 weeks (right panel). IL-10 and IL-13 expression levels indicated a strongly anti-inflammatory profile for POC/MSCs or POC/MSC + CD34+ HSPCs. Notably, at 4 weeks the presence of MSCs increased mean expression of IL-10 and IL-13 from <20% of the cell population in the unseeded group to >70% in MSC-seeded groups (4W: uPOC 16.3 ±0.8% IL-10+ and 12.8 ±4.1% IL-13+ vs. POC/MSC 74.6 ±5.1% IL-10+ and 77.0 ±1.5% IL-13+, POC/MSC + CD34+ HSPCs 81.7 ±5.2% IL-10+ and 80.1 ±5.3% IL-13+; 10W: uPOC 9.9 ±0.3% IL-10+ and 10.7 ±1.3% IL-13+ vs. POC/MSC 16.0 ±1.6% 42.0 ±1.4% IL-10+ and 37.6 ±1.2% IL-13+, POC/MSC + CD34+ HSPCs 47.6 ±1.8% IL-10+ and 47.7 ±1.6% IL-13+). Significant effects were not observed for POC/CD34+ HSPCs grafts (4W: 23.3 ±2.9% IL-10+ and 18.6 ±2.6% IL-13+; 10W: 15.4 ±3.2% IL-10+ and 12.6 ±1.8% IL-13+). Data shown as means ±SE. Significance shown for comparison of cell-seeded groups to uPOC; *P <0.05, **P <0.01, ***P ≤0.001, ****P <0.0001.

