
Fig. 4.
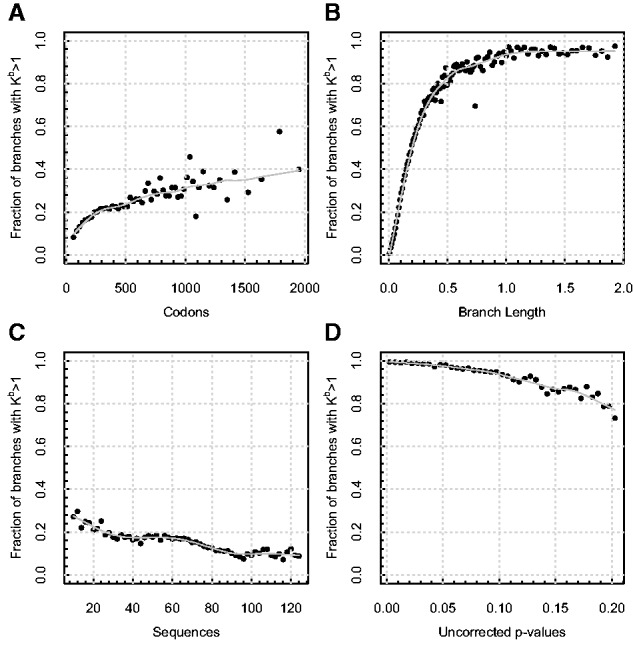
Correlates of signal for evolutionary process complexity in the selectome data sets. Each panel depicts the fraction of all alignments reported by aBSREL as having more than one ω rate class selected by the step-up procedure (Kb), as a function of (A) the length of the alignment (codons), censored at 2,000 due to sparse sampling afterwards (binned in increments of 50 codons); (B) branch length (expected substitutions per site [binned in increments of 0.01]); (C) the number of sequences (binned in increments of 2 sequences); (D) uncorrected P value for episodic positive selection (binned in increments of 0.005). Each point represents an average over at least 100 individual branches. Lowess smoothing polynomials (smoothing span 0.25) are shown in solid light gray.