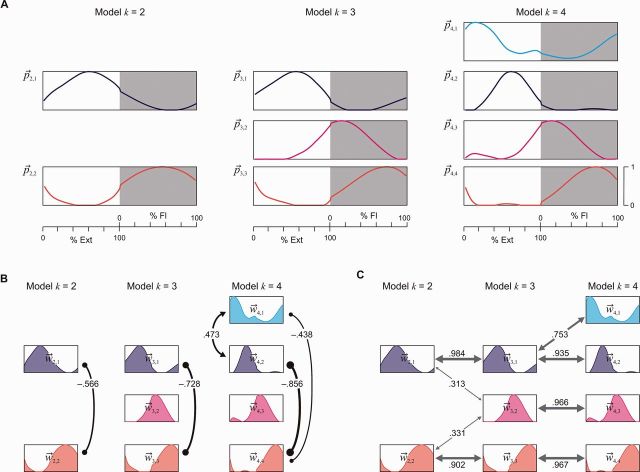
Figure 4.
Basic activation patterns and relations between their weights identified by non-negative matrix factorization from the pooled EMG-profile data across all subjects, muscles and samples of rhythmic EMG patterns. (A) Amplitude-normalized basic activation patterns shown for the models with k = 2, 3, and 4, ordered according to the relative timing of their peaks. (B) Negative (lines ending with small filled circles) and positive (lines ending with arrowheads) correlations between the weights of different basic activation patterns within each model indicate the tendency of reciprocal or simultaneous loading of two patterns. (C) Positive correlations in-between models, informing on preservation or splitting of basic activation patterns with increasing number of k. In B and C, only (Bonferroni corrected) correlations with P < 0.05 are illustrated. Index j in and enumerates the basic activation patterns based on their peak-timing; Ext = extension and Fl = flexion phase.

