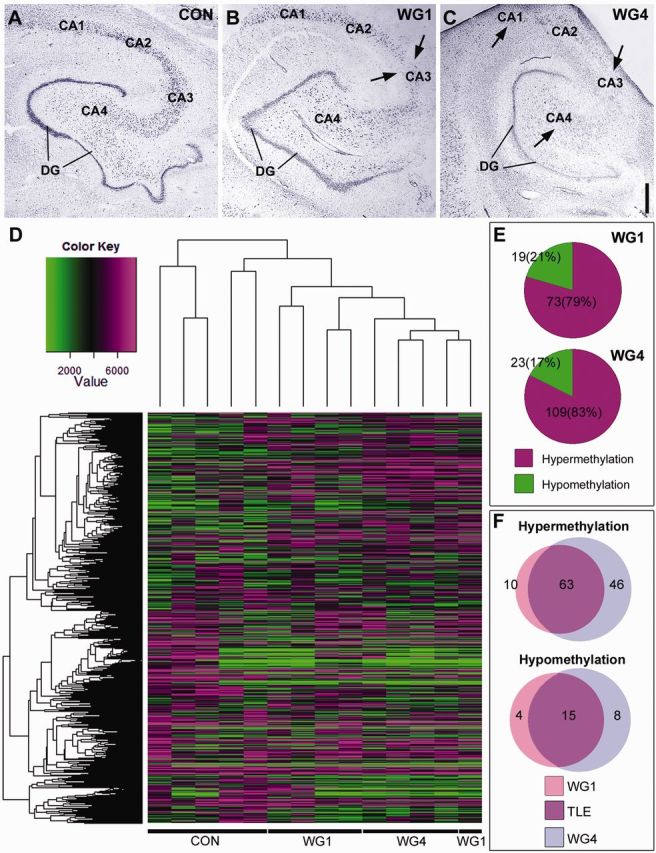
Figure 1.

Methylation of protein-coding genes defines hippocampal sclerosis in temporal lobe epilepsy. (A–C) Cresyl violet staining illustrating Watson grading of hippocampal sclerosis in representative human temporal lobe epilepsy samples compared to controls. Areas of cell loss are marked by arrows. Scale bar = 1 mm. (D) Dendrogram showing the hierarchical clustering of raw data methylation profiles of Control, WG1 and WG4 groups. Hypomethylation locations are signified by green and hypermethylation locations by magenta areas. Value represents the average of the probes for a given region (from −2 kb to + 500 bp around the transcriptional start site). This value was calculated for each gene that is represented on the histogram. (E) Pie charts illustrating the percentage of differential hypermethylation and hypomethylation events in WG1 and WG4 when either group was compared to control. Differential hypermethylation of promoter regions is prominent in both WG1 and WG4. (F) Venn diagrams illustrating the differential methylation profiles of WG1 and WG4 in terms of the number gene promoters involved. Methylation events unique to WG1 are shown in pink, those unique to WG4 are shown in blue and those unique to temporal lobe epilepsy regardless of hippocampal sclerosis grade are shown in purple. Control (Con), Watson Grade 1 (WG1), and Watson Grade 4 (WG4). DG = dentate gyrus; TLE = temporal lobe epilepsy.
