Figure 3.

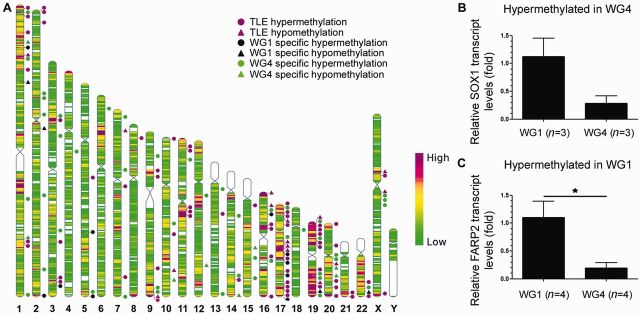
Distribution of differentially methylated gene promoters and protein-coding gene expression. (A) Differential methylation events occurred at random throughout the genome and positional gene enrichment analysis of all datasets confirmed no enrichment of any genomic region. The location of differentially methylated genes in temporal lobe epilepsy regardless of hippocampal sclerosis grade are marked by magenta shapes. Genes with unique methylation profiles in WG1 are marked by black shapes and those in WG4 by green shapes. Triangles denote hypomethylated gene promoters and circles, hypermethylated gene promoters. Heat map indicates gene density. (B) A substantial decrease in SOX1 expression was evident in WG4 compared to WG1, aligning with hypermethylation of this gene promoter in WG4. This downregulation was not statistically significant, considering the small number of samples tested (n = 3 for both groups, ∼4-fold reduction; P = 0.07). (C) FARP2 expression was found to be significantly upregulated in WG1 compared to WG4, contrary to findings of differential hypermethylation in WG1 (n = 4 for both groups, P = 0.02). TLE = temporal lobe epilepsy.
