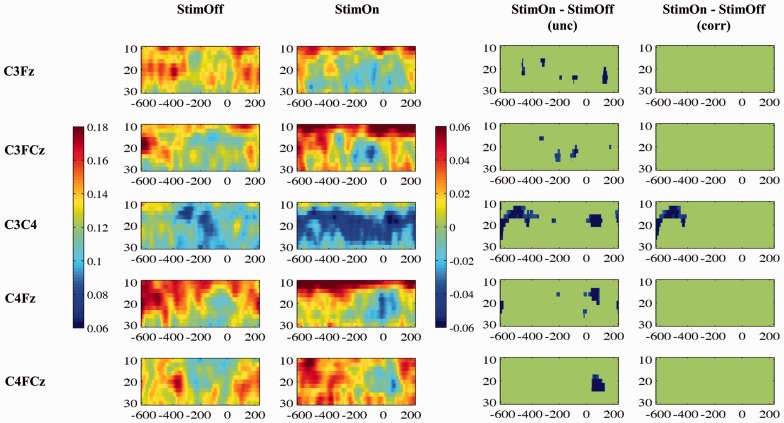
Figure 3.
Time-frequency cross-coherence between cortical regions of interest. The first column indicates the grand average spectra in StimOff, the second column in StimOn. The coherence magnitude is indicated by the colour bar (scale from 0.06 to 0.16). As third column, the statistical comparison between StimOff and StimOn (uncorrected) is given, and the fourth column includes correction for multiple comparisons. The difference in coherence magnitude StimOn minus StimOff is indicated by the right colour bar, and non-significant time-frequency samples are ‘zeroed out’ and masked in green (scaled from 0.06 to −0.06). x-axis: Time (ms), where time ‘0’ denotes registration of the finger tap; y-axis: Frequency (Hz).

