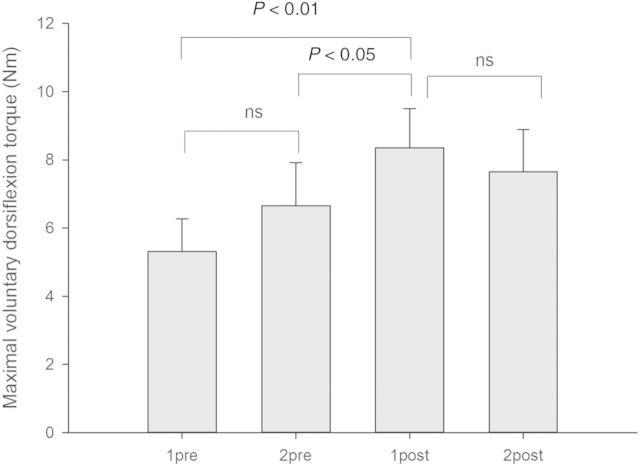
Figure 1.
Changes in maximal voluntary dorsiflexion in relation to gait training. The columns show the maximal voluntary dorsi flexion torque at the first (1pre) and second (2pre) sessions prior to training and the first (1post) and second (2post) sessions following training. Statistically significant differences between sessions are indicated by P-values in the figures (ns = no significant difference). Vertical bars are one standard error of the mean. All torque values are in Nm.

