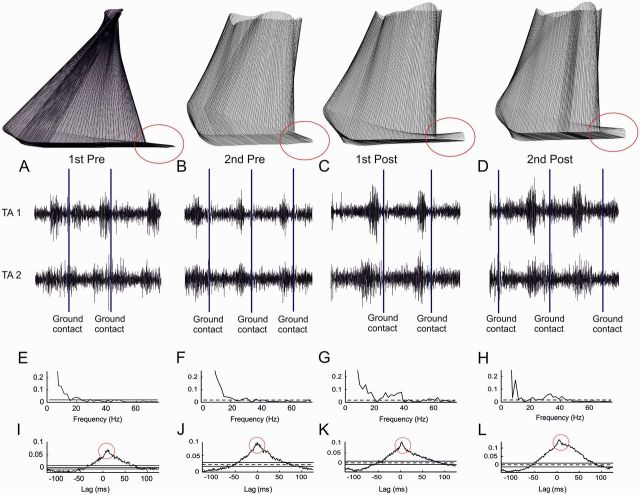
Figure 2.
Kinematics of gait and coherence estimates from a single child. The stick diagrams in the top row indicate the movement of the affected lower limb during one gait cycle in the typical child with cerebral palsy. Note that the child failed to lift the toes in the end of the swing phase prior to training (1st Pre and 2nd Pre) and made contact with the ground primarily with the mid- and forefoot. Following training, clear lift of the toes was observed (1st Post and 2nd Post). (A–D) Sampled EMG from the two sets of electrodes placed over the tibialis anterior muscle (tibialis anterior 1 and tibialis anterior 2). Ground contact is indicated by vertical solid lines. (E–H) Coherence calculated between the two EMG recordings obtained for the 400 ms time period prior to ground contact. (I–L) Cumulant density functions associated with the coherence obtained between the two EMG recordings. Red circles are used to highlight the absence (I and J) and presence (K and L) of a short-lasting central peak in the cumulant density function indicating short-term EMG-EMG synchronization sitting on top of the broader peak produced EMG fluctuation over this section of the gait cycle. A, E and I are from recordings in the first pretraining session; B, F and J from the second pretraining session; C, G and K from the first post-training session; and D, H and L are from the second post-training session.

