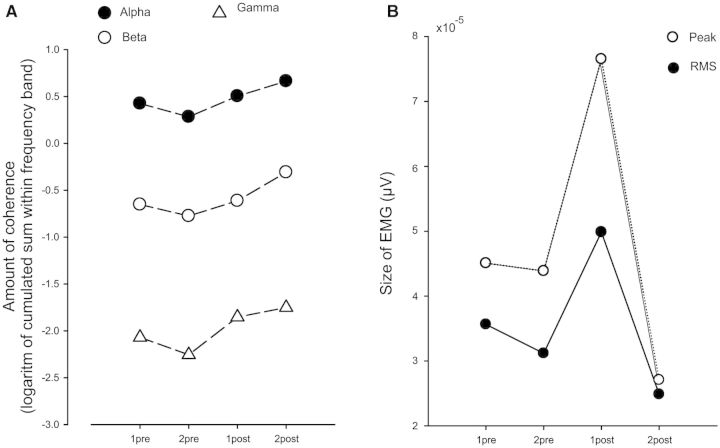
Figure 4.
Pooled estimates of coherence and EMG in all 16 children with cerebral palsy. The cumulated sum of the logarithmic values of coherence was estimated for all children in the alpha (5–15 Hz), the beta (15–35 Hz) and gamma bands (35–65 Hz). The respective values are indicated for the four test sessions in A. The size of the largest peak of tibialis anterior EMG was calculated in all children for the most proximal electrode recording and displayed as open circles in B. Filled circles indicate the root mean square (RMS) value calculated for the same recordings. Note that lines depicting standard deviations have been omitted due to their large size.

