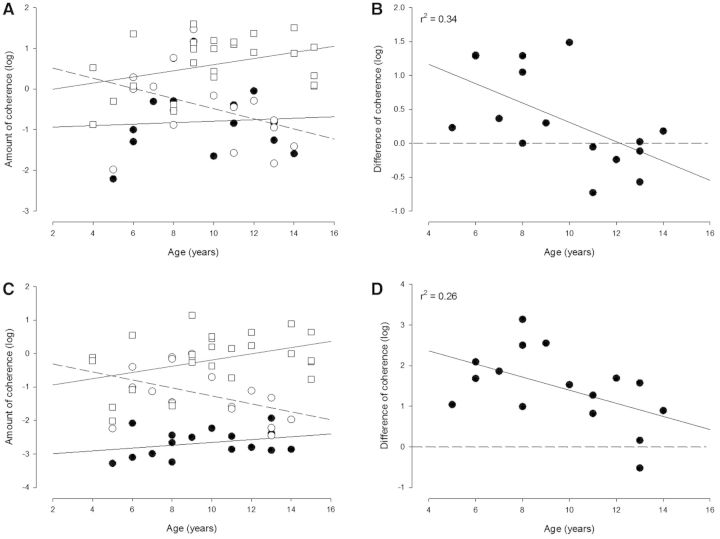
Figure 6.
Relation between changes in coherence and age in the population of children with cerebral palsy and comparison to healthy children. The magnitude of coherence in the beta (A and B) and gamma (C and D) band is shown for each child with cerebral palsy before (filled circles in A and C) and after training (open circles in A and C) as a function of age. The amount of coherence before training is the average of the amount of coherence measured at the two sessions before training. For comparison, the magnitude of coherence in the two frequency bands is also shown for healthy children (open squares). In B and D the difference in coherence in the beta (B) and gamma (D) frequency bands before and after training is shown for the children with cerebral palsy and plotted against age (coherence values in the first test session post-training were subtracted from the values of coherence obtained in the first session pretraining). The full lines in A and C depict the linear regression lines for the data from children with cerebral palsy before training, the dotted lines regression lines from healthy children and the dashed lines regression lines for the difference in coherence before and after training for the children with cerebral palsy. In B and D the horizontal dashed line depicts zero, whereas the full line depicts the regression line for the data.

