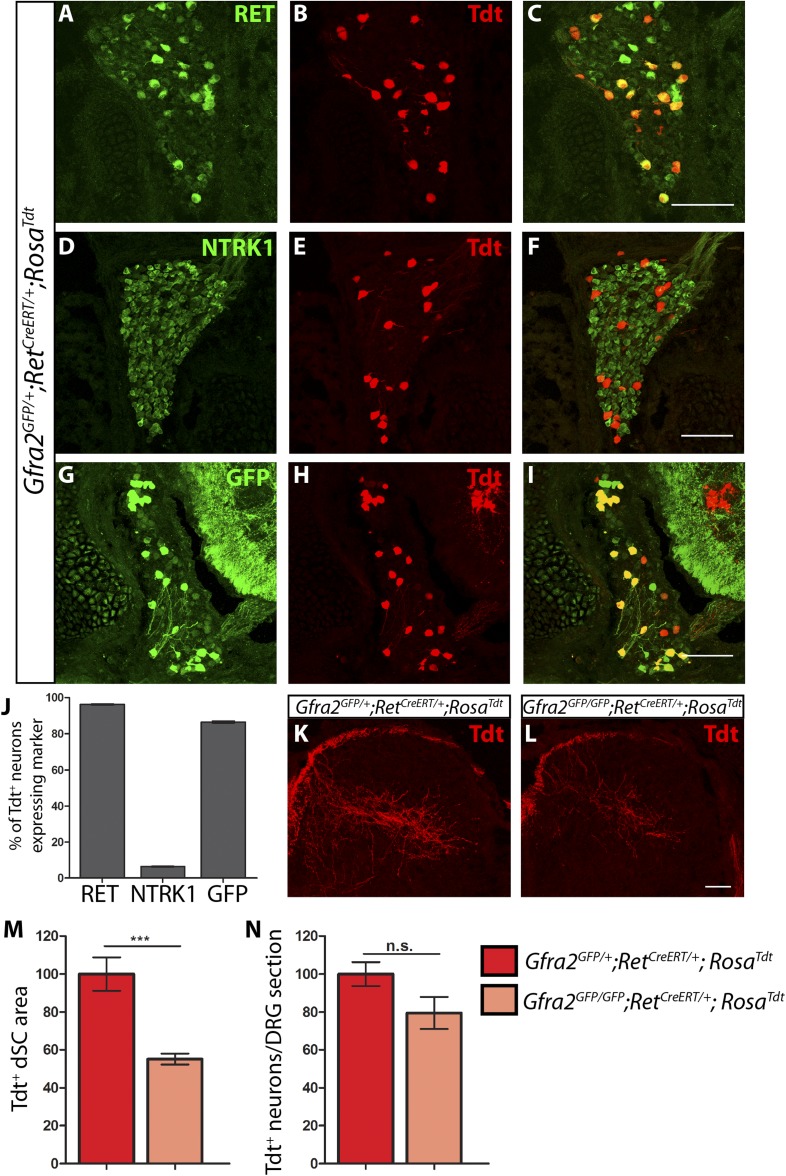
Figure 3. Central projection growth deficit of Gfra2 null RA mechanoreceptors at E15.5.
(A–I) E15.5 Gfra2GFP/+;RetCreERT/+;RosaTdt DRG sections stained with anti-RET (A–C), anti-NTRK1 (D–F), and anti-GFP (G–I). (J) Quantification of percentage of Tdt+ DRG neurons which co-express RET (96.16 ± 0.28%), NTRK1 (6.56 ± 0.18%), and GFP driven from the Gfra2 locus (86.48 ± 0.55%). The expression profile of Tdt+ neurons confirms that this genetic labeling strategy specifically labels RA mechanoreceptors. (K–L) Visualization of Tdt+ RA mechanosensory central projections in dSC of E15.5 Gfra2GFP/+; RetCreERT/+; RosaTdt control (K) and Gfra2GFP/GFP; RetCreERT/+; RosaTdt mutant (L) SC sections. (M) Quantification of Tdt+ pixels in dSC, which is displayed as a percentage normalized to dSC Tdt+ pixels of the within litter controls. Gfra2 mutant mice have 55.13 ± 2.82% of control staining (p < 0.001). Note that although Gfra2 null RA mechanoreceptors still have a central projection deficit at E15.5, the reduction at this stage is less severe than the deficit observed at E13.5. (N) Quantification of number of Tdt+ neurons per DRG section, which is displayed as a percentage normalized to Tdt+ neurons of the within litter controls. Gfra2 mutant mice have 79.52 ± 8.39% of control cell number (p = 0.06), which suggests that the survival of RA mechanoreceptors is not dependent on cis signaling at this stage. Scale bars = 100 μm (A–I), 50 μm (K–L). Error bars represent SEM. n.s. = p > 0.05, *** = p < 0.001. Source data are provided in Figure 3—source data 1.
DOI: http://dx.doi.org/10.7554/eLife.06828.010


