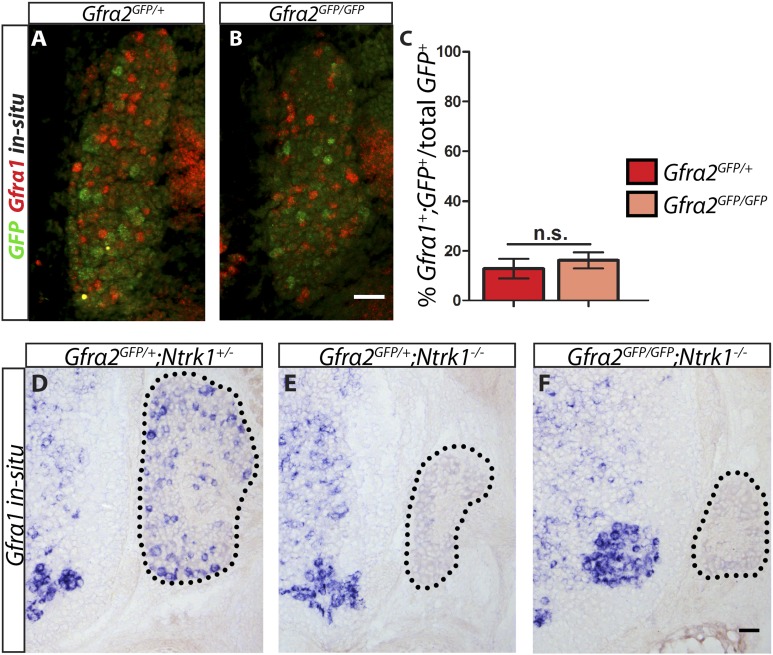
Figure 6. Gfra1 is not upregulated in Gfra2 null RA mechanoreceptors.
(A–B) Double fluorescent in situ hybridization against GFP and Gfra1 on E14.5 Gfra2GFP/+ control (A) and Gfra2GFP/GFP null (B) DRG sections. (C) Quantification of percentage of GFP+ neurons which co-express Gfra1. 12.81 ± 3.92% of control GFP+ neurons express Gfra1, and 16.17 ± 3.31% of Gfra2 null GFP+ neurons express Gfra1 (p = 0.52). The comparable low number of DRG neurons co-expressing GFP and Gfra1 in control and Gfra2 nulls suggests that Gfra1 normally is not expressed in most RA mechanoreceptors and that no upregulation of Gfra1 occurs in Gfra2 null RA mechanoreceptors. (D–F) In situ hybridization against Gfra1 in P0 Gfra2GFP/+;Ntrk1+/− control (D), Gfra2GFP/+;Ntrk1−/− null (E), and Gfra2GFP/GFP;Ntrk1−/− double null (F) DRG and SC sections. Black border outlines DRG. In control DRG sections, Gfra1 is expressed in some DRG neurons. In Gfra2GFP/+;Ntrk1−/− null DRG sections, Gfra1 transcript is not detected because the DRG neurons which normally express detectable levels of Gfra1 don't survive in the absence of Ntrk1. In Gfra2;Ntrk1 double null mice, no Gfra1 expression is detected in DRG neurons as well, which further supports that upregulation of Gfra1 doesn't occur in Gfra2 null RA mechanoreceptors. Scale bars = 50 μm. Error bars represent SEM. n.s. = p > 0.05.
DOI: http://dx.doi.org/10.7554/eLife.06828.017


