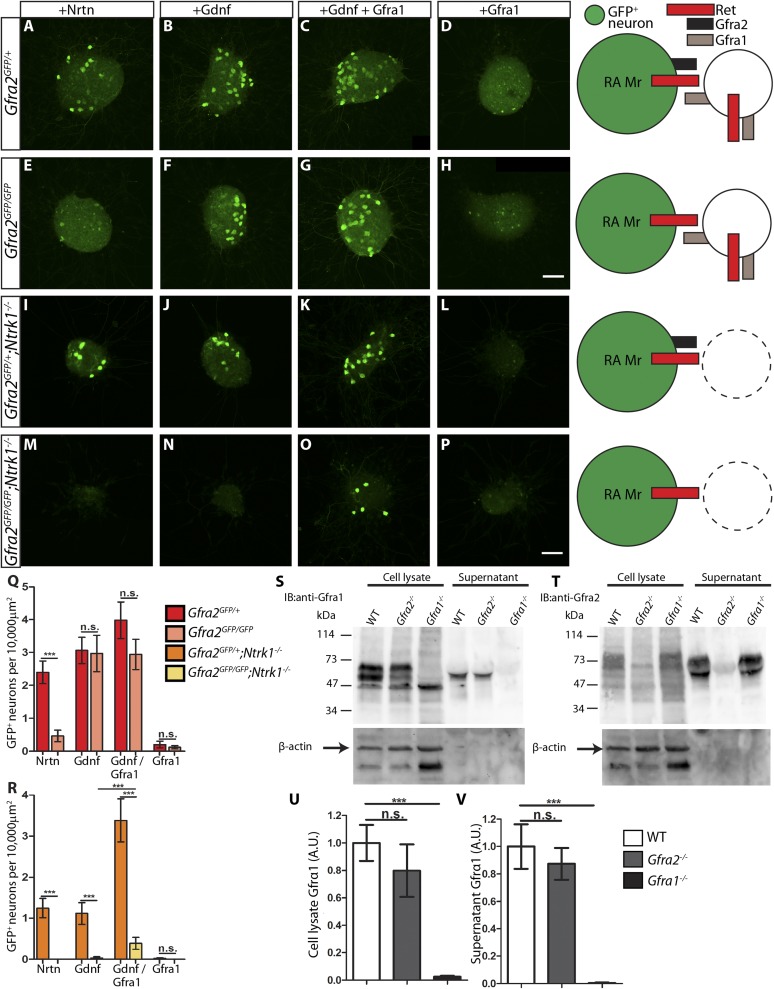
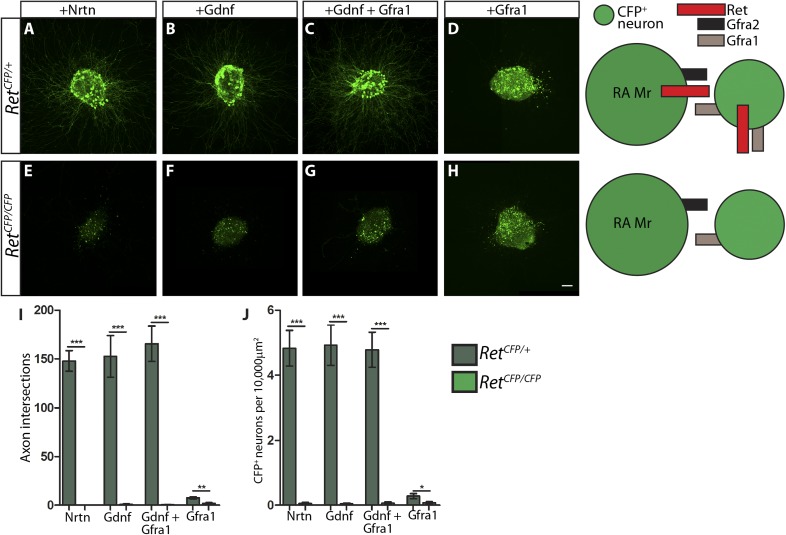
Figure 7. RA mechanoreceptors utilize GFRa1 produced by neighboring neurons to respond to GDNF.
(A–P) DRG explants from Gfra2GFP/+ control (A–D), Gfra2GFP/GFP null (E–H), Gfra2GFP/+;Ntrk1−/− null (I–L), and Gfra2GFP/GFP;Ntrk1−/− double null (M–P) embryos grown for 1 day in vitro and stained with anti-GFP antibody. Explants were treated with NRTN (50 ng/ml), GDNF (100 ng/ml), GDNF (100 ng/ml) plus GFRa1 (300 ng/ml), or GFRa1 (300 ng/ml), respectively. Schematic next to each genotype depicts the presence of RET and GFRas in each condition, and green color indicates cells detected by anti-GFP staining. (Q) Quantification of number of GFP+ neurons per 10,000 μm2 of explant in Gfra2GFP/+ control and Gfra2GFP/GFP null explants. GFP driven from the Gfra2 locus indicates RET signaling activity. Gfra2 control explants display many GFP+ neurons upon NRTN, GDNF, and GDNF plus GFRa1 treatment, but do not respond to GFRa1 alone. Gfra2 null explants lose their responsiveness to NRTN, but remain responsive to GDNF and GDNF plus GFRa1. (R) Quantification of number of GFP+ neurons per 10,000 μm2 of explant in Gfra2GFP/+;Ntrk1−/− null and Gfra2GFP/GFP;Ntrk1−/− double null explants. In a Ntrk1 null background, expression of Gfra1 is lost in non-RA-mechanoreceptor DRG neurons. Gfra2GFP/+;Ntrk1−/− null explants respond to NRTN, GDNF, and GDNF plus GFRa1. In this case, it is likely that GDNF activates RET signaling by interacting with GFRa2 (Jing et al., 1997; Sanicola et al., 1997; Rossi et al., 1999). In contrast, Gfra2;Ntrk1 double null DRG explants show GFP expression upon treatment with a combination of GDNF and GFRa1, but completely lose their responsiveness to GDNF. These results indicate that Gfra2 null RA mechanoreceptors do not express GFRa1 at a functional level and they depend on GFRa1 produced by neighboring NTRK1+ neurons to respond to GDNF. See Figure 7—source data 2 for quantification. (S–V) Western blot analysis of cell lysates and concentrated supernatants from cultured dissociated DRG neurons of E18.5-P1 wild-type, Gfra2 null, and Gfra1 null mice. (S) The specificity of the anti-GFRa1 antibody was confirmed by the loss of a doublet at the predicted size of GFRa1 in Gfra1 null cell lysates. GFRa1 was also detected in the supernatants of wild-type and Gfra2 null cultures, but not Gfra1 null cultures, indicating that GFRa1 is shed from the membrane of DRGs of both wild-type and Gfra2 mutants. Note that the size of cleaved GFRa1 is slightly smaller than that tethered to cells, which is consistent with previous publication (Paratcha et al., 2001). Following detection of GFRa1, membranes were stripped and probed for β-actin, which served as a loading control and confirmation that the supernatant fraction was not contaminated with cells or cellular debris (lower panel). (T) The specificity of the anti-GFRa2 antibody was confirmed by the loss of a band ∼75 kDa in Gfra2 null cell lysates. The larger than predicted size of GFRa2 may be due to post-translational modifications. Two GFRa2 specific bands were also detected in the supernatants of wild-type and Gfra1 null cultures, but not Gfra2 null cultures, indicating that GFRa2 is also shed from DRG cell membranes. The size of cleaved GFRa2 is also smaller than that tethered to cells. (U–V) Densimetric quantification of anti-GFRa1 blots shows no significant change in the level of GFRa1 produced by cells (U) or released into the media (V), which suggests that there is no compensation for the loss of GFRa2 through changes in the expression or release of GFRa1. See Figure 7—source data 3 for quantification. Error bars represent SEM. Scale bars = 50 μm. n.s. = p > 0.05, *** = p < 0.001. Source data are provided in Figure 7—source data 2, 3.
DOI: http://dx.doi.org/10.7554/eLife.06828.020


