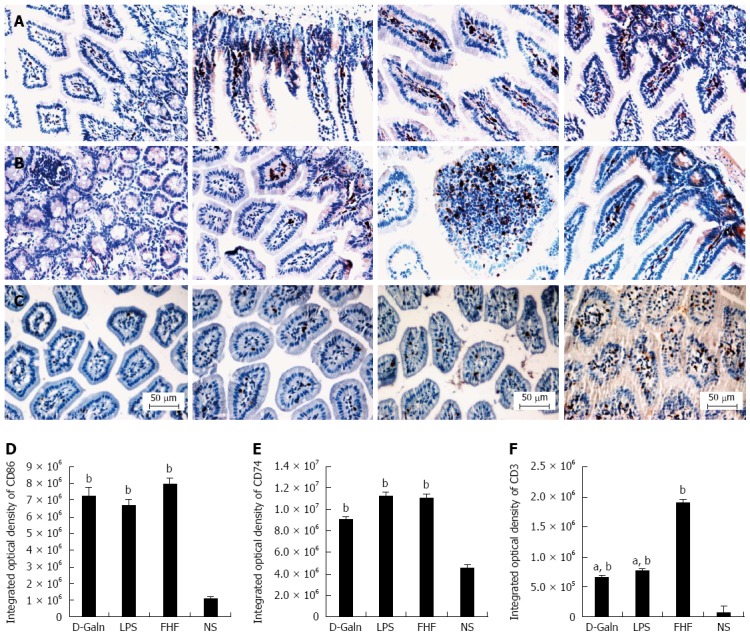
Figure 4.

Immunohistochemical staining of CD86 (A), CD74 (B), and CD3(C) and integrated optical density of CD86 (D) CD74 (E), and CD3 (F). From left to right panel: Normal saline (NS) group, D-galactosamine (D-Galn) group, lipopolysaccharide (LPS) group, and fulminant hepatic failure (FHF) group (A, B and C). The integrated optical density of CD86 (D) and CD74 (E) in the FHF group was notably increased compared to the NS group. However, CD86 and CD74 were not significantly different among the FHF, LPS and D-Galn groups. The integrated optical density of CD3 in the FHF group was notably increased compared with the NS, LPS and D-Galn groups (bP < 0.001 vs the NS group, aP < 0.05 vs LPS and D-Galn groups, one-way ANOVA with Dunnett test; n ≥ 15).
