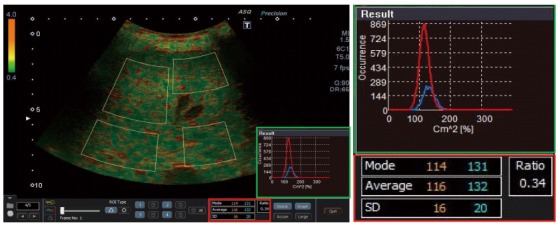
Figure 1.

Acoustic structure quantification analysis of liver tissue. Four separate regions of interest were drawn to cover most of the parenchyma, but avoiding large vessels. The acoustic structure quantification software automatically calculated the parameters mode, average and standard deviation for both curves of the histogram (green frame), as well as the ratio of the areas under both curves (focal disturbance ratio, red frame).
