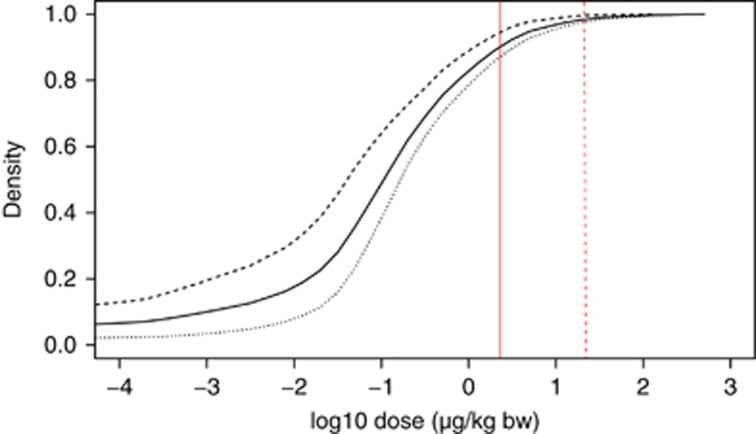
Figure 2.
Cumulative distributions of single-day diethyl phthalate (DEP) exposures. Solid line: men and women. Dashed line (left): men; dotted line (right): women. Vertical lines represent DEP dose estimates from the biomonitoring data by Koch et al.17 Solid line: median; dashed line: 95th percentile.

