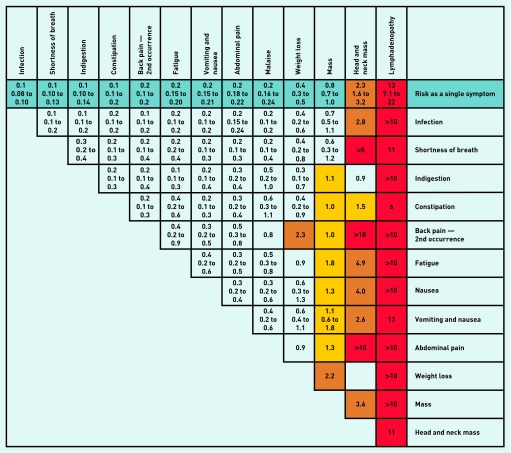
Figure 2.
Positive predictive values for non-Hodgkin lymphoma symptoms in patients aged ≥ 60 years, for single and paired features.
Notes: The positive predictive value (PPV) is shown on the first line of each cell with the 95% CIs shown underneath. PPVs were not calculated if < 5 cases had the feature. Where < 10 cases or controls had the combined features, CIs were omitted. Where no control had the combination of paired symptoms a label of > 5 or > 10 was given; although strictly undefined, these PPVs are likely very high. The yellow shaded cells indicate a PPV of 1.0–1.9%; orange cells 2.0–4.9%; and red cells ≥ 5%. The cells showing the same feature vertically and horizontally represent a second attendance with the same investigation.

