Abstract
Little is known about aberrant antigen expression patterns and their association with cytogenetic aberrations in multiple myeloma (MM). We examined the correlation between flow cytometry and florescence in-situ hybridization (FISH) in 167 marrow specimens with MM. Gene expression profiling of CD56, CD117, CD52 and CD20 mRNA in plasma cells (PCs) from patients treated on Total Therapy 2 and Total Therapy 3 trials were also evaluated. Higher expression of CD56 and CD117 was associated with hyperdiploidy. High CD52 mRNA expression was associated with c-MAF and FGFR3 subgroups. Higher expression of CD56 mRNA, but lower Kit expression, were noted in association with FGFR3. In contrast, the c-MAF subgroup showed high Kit expression but lacked NCAM mRNA expression. CKS1B amplification showed positive correlation with CD52 0.02) but negative correlation with CD20 (p=0.0108). These findings indicate that phenotypic differences in MM are associated with distinct genetic subgroups, which potentially has important diagnostic and prognostic value
Introduction
Plasma cell (PC) neoplasms are a heterogeneous group of disorders with differing clinical manifestations. The phenotypic features of neoplastic PCs in multiple myeloma (MM) vary greatly, depending on the disease stage and specific biological characteristics of each patient [1–4]. Distinction between clonal neoplastic PCs and non-neoplastic PCs is determined by the differential expression pattern of a constellation of markers, including CD138, CD38, CD45, CD56 and CD117 along with cytoplasmic/surface light chains, instead of a single marker [5–7].
MM can be stratified according to chromosomal aberrations into hyperdiploid (HD) and non-hyperdiploid (NHD) groups [8,9]. Fifty to sixty percent of all described tumors are classified as HD tumors, characterized by the presence of 48-75 (mostly 49–58) chromosomes, with extra copies of two or more of eight odd-numbered chromosomes: 3, 5, 7, 9, 11, 15, 19 and/or 21 [10]. Published reports have shown that detection of extra copies of two of the odd-numbered chromosomes by interphase fluorescence in situ hybridization (FISH) assays provides a reliable method of detecting HD tumors [1]. NHD tumors can be hypodiploid (with fewer than 45 chromosomes), near tetraploid (with more than 80 chromosomes) or pseudodiploid. Furthermore, primary immunoglobulin heavy chain (IgH) translocations are present in 60–70% of NHD tumors, whereas they are present in only 15% of HD tumors. Recent studies have shown that five common primary translocations are strongly associated with a NHD genotype, including Cyclin D: CCND1 at 11q13 and CCND3 at 6p21; MAF: c-MAF at 16q23 and MAFB at 20q12; and MMSET and FGFR3 at 4p16 [1,8,9].
These findings indicate that genetic events are important indicators of prognosis in MM. Several studies have shown that genetic findings can be used to establish risk categories in MM [11]. High-risk genetic features include hypodiploidy and loss of TP53, and translocations resulting in deregulation of FGFR3 and MAF genes, of 48–75 (mostly whereas favorable features include HD, and CCND1 or CCND3 abnormalities [12].
CKS1B, a Cdc28 protein kinase regulatory subunit, is a member of the Cks/Suc1 family of proteins, which are essential components of cyclin-dependent kinases. Interestingly, CKS1B is mapped to 1q21, one of the most recurrent chromosomal aberrations observed in MM, and correlates with disease progression and poor outcome [13]. Overexpression studies of CKS1B resulted in an increase in multidrug resistance in neoplastic PCs [14].
FISH studies for MM often need enrichment of PCs [15]; although effective, the technique is time- and labor- intensive. In contrast, immunophenotyping has proven a sensitive and powerful approach for both diagnosis and follow-up of many hematolymphoid neoplasms. Multi-parameter flow cytometry has increased our ability to screen large numbers of cellular events, and aids in diagnosis, prognostic stratification and identification of potential therapeutic targets for these neoplasms.
Other than the established association between CD20, CCND1 and t(11;14) translocation [16], very little is known about aberrant antigen expression patterns and their correlation with cytogenetic aberrations in MM. Either aberrant antigens or cytogenetic abnormalities hold potential for being targeted in therapy tailored to the individual patient. In the present study, we aimed to examine the correlation between immunophenotype and FISH abnormalities to identify possible immunophenotypic patterns that may serve as surrogate markers predicting specific genetic abnormalities.
Materials and Methods
Patient samples for flow cytometry / FISH correlation cohort
This study was approved by the Institutional Review Board at the University of Utah. A retrospective review of 1633 consecutive bone marrow samples from the University of Utah/ARUP reference laboratory from 1 January 2011 to 17 June 2012 identified 167 bone marrow specimens from patients with MM which had concurrent and informative flow cytometry and cytogenetic results.
Flow cytometry analysis
The selected bone marrow specimens in the flow cytometry/FISH cohort were analyzed by five-color flow cytometry as a part of routine clinical assessment on a FC500 flow cytometer (Beckman Coulter, Miami, FL), using CXP software (Beckman Coulter). The following antibodies were used for flow cytometric evaluation of PCs: CD38, CD45, CD138, CD20, CD117 (Beckman Coulter, Immunotech), CD19 (Coulter Cyto-Stat), CD52 (BioLegend, San Diego, CA) and kappa/lambda light chains (Becton Dickinson, San Diego, CA). PCs were interrogated through a combination of gating strategies applied to every case using the markers listed. First, plots of CD45 and light scatter in conjunction with cytoplasmic kappa (cK) and lambda (cL) light chains were utilized to determine the distribution of PCs. Subsequently, we utilized bright CD38, along with CD138 and CD56, cK and cL to define clonal PCs. Additional plots of CD38 and CD45 in conjunction with other markers including CD52, CD117 and CD19 were then evaluated to further characterize PC phenotype (Figure 1). Partial expression of a marker was considered positive if expressed in > 20% of clonal PCs.
Figure 1.
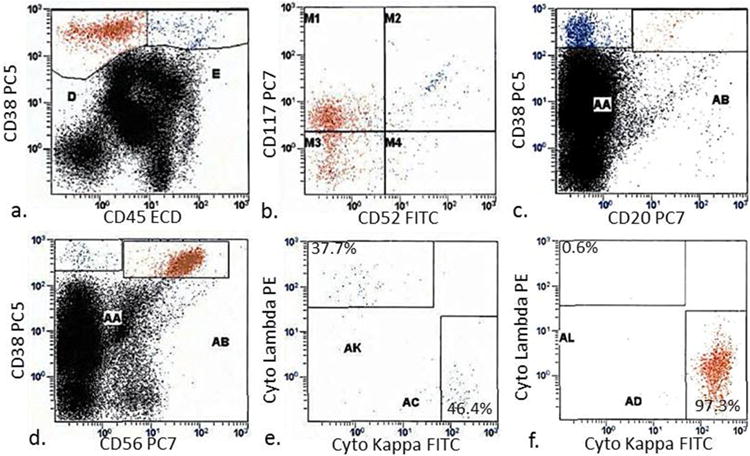
To assess marker expression by flow cytometry, plasma cells were gated based on bright CD38 and dim-negative CD45 expression (a), and further evaluated for the expression of CD52, CD117 (b) and CD20 (c). CD56 positive and negative cells were analyzed for intracellular kappa and lambda light chains (d – f). (e) and (f) represent AA and AB gates from panel (d), respectively
Fluorescent in situ hybridization (FISH) analysis
PC sorting was performed using a column-free automated method, RoboSep (RS) (StemCell Technologies, Vancouver, BC, Canada), that enriches for CD138 + cells as previously described [14]. Following sorting, cell suspensions were analyzed for cellularity by phase contrast microscopy. FISH analysis was performed with the following probes: CKS1B, TP53 (Cytocell Ltd., Cambridge, UK), ASS1, CCND1/IGH XT, IGH@ break apart and PML (Abbott Molecular, Abbott Park, IL) on CD138 + sorted cells. When an IgH rearrangement and/or deletion was detected, additional FISH analysis with FGFR3/IGH@ and IGH@/MAF probe sets (Abbott Molecular) was also performed. Two hundred interphase cells were scored for each probe combination
mRNA Gene expression profiling training and test sets
Gene expression profiling of highly purified bone marrow PCs was performed in an independent cohort composed of 413 newly diagnosed patients with MM. The training set consisted of 256 cases enrolled on the Total Therapy 2 (TT2) trial. The test set comprised 157 patients enrolled on Total Therapy 3 (TT3); it served to validate the gene expression findings in TT2 samples as previously published [17], and is freely available from the National Institutes of Health (NIH) Gene Expression Omnibus (GSE2658) [18]. TT2 and TT3 trial design and dosing have been previously described [19], and are briefly described here. Both protocols used melphalan-based tandem transplants. TT2 induction consisted of VAD (vincristine, Adriamycin, dexamethasone) followed by DCEP (dexamethasone and 4-day continuous infusions of cyclophosphamide, etoposide, cisplatin), cyclophosphamide, doxorubicin, dexamethasone with collection of peripheral blood stem cells, and a further cycle of DCEP. TT2 consolidation varied and eventually used DPACE (dexamethasone and 4-day infusions of cisplatin, doxorubicin, cyclophosphamide, etoposide) quarterly for 1 year. Maintenance therapy for TT2 consisted of dexamethasone pulsing in year 1 with interferon-α2B, which was then continued indefinitely until recurrence or intolerance.
TT3 used two cycles of VTD (bortezomib, thalidomide, dexamethasone)-PACE for induction before and consolidation after tandem transplants; this was followed by VTD maintenance therapy in year 1 and TD maintenance in years 2 and 3. In the TT2 and TT3 cohort, correlation of CD20, CD52, neural cell adhesion molecule (NCAM; CD56) and Kit (CD117) was performed only using mRNA expression for these markers, and not with flow cytometry data, which was not available.
mRNA Gene expression profiling
PC purifications and gene expression profiling (GEP), using the Affymetrix U133Plus2.0 chip, was performed as previously described [14,20]. Signal intensities were preprocessed and normalized by GCOS1.1 software (Affymetrix, Santa Clara, CA). GEP was assessed for CD20, CD52, NCAM (CD56) and Kit (CD117) in seven MM sub-groups based on common gene expression signatures. The seven subgroups were strongly influenced by the coordinated overexpression of specific genes, many with anchoring genes such as c-MAF and MAFB, CCND1, CCND3, ASS1, IL6R, MMSET, FGFR3, CCNB2, FRZB and DKK1 [17]. The t(14;16)(q32;q23) and t(14;20)(q32;q12) translocations result in activation of c-MAF and MAFB proto-oncogenes, respectively, and together they were designated the MF subgroup. The reciprocal t(4;14)(p16;q32) translocation results in the hyper-activation of both FGFR3 and MMSET genes, and this group was designated MS; further, two Cyclin D family members, CCND1 and CCND3, are activated by t(11;14)(q13;q32) and t(6;14)(p21;q32). Hyperdiploid, low bone disease and proliferation subgroups were designated HD, LB and PR, respectively.
Data for comparison of mRNA expression of CD56, CD117 and CD52 in normal PCs, MM cells and monoclonal gammopathy of unknown significance (MGUS) cells were obtained from microarray data that have been deposited in the NIH Gene Expression Omnibus (GEO; National Center for Biotechnology Information [NCBI], http://www.ncbi.nlm.nih.gov/geo/) under accession number GSE2658 for 351 patients with MM and under accession number GSE5900 for 22 patients with normal PCs and 44 with MGUS [21].
Statistical analysis
Statistical analysis of data was carried out using GraphPad Prism software, version 5.0 (GraphPad Software, Inc., San Diego, CA). Χ2 and Fisher exact tests were used to assess the statistical significance of differences found between categorical variables. Statistical significance was set at p < 0.05 (two-sided). GEPs were done on CD138 + bone marrow PCs from patients with MM enrolled in TT2 and TT3. Signal intensities were pre-processed and normalized using GCOS1.1 software (Affymetrix). Bar graphs are used to present gene expression levels in different groups, and Student's t-test and one-way analysis of variance (ANOVA) were used to compare gene expression differences in two groups and more than two groups, respectively.
Results
Plasma cell aberrant antigen expression by flow cytometry
Flow cytometry analysis of CD20, CD52, CD56, CD19 and CD117 on neoplastic PCs was available in 167 patient samples, which displayed distinctive heterogeneity of antigen expression patterns of these markers. CD56 was the most frequent aber- rant marker detected in 60% of samples, followed by CD117 at 36%. CD20 and CD52 were expressed in a lower number of cases, whereas CD19 + MM samples proved elusive, with expression in only 1% of samples (Table I). Coexpression of more than one aberrant marker was noted in 63 (38%) of cases and no aberrant expression was noted in 28 (17%) of cases.
Table 1.
Aberrant antigen expression frequency in neoplastic PCs in 167 patients. Double expression of CD56 and CD117 was noted in 22% of cases.
| Aberrant antigen | No.of Positive cases tested | % positive |
|---|---|---|
| CD56 | 100 | 60% |
| CD117 | 42 | 36% |
| CD20 | 33 | 20% |
| CD52 | 25 | 15% |
| CD19 | 2 | 1% |
Plasma cell aberrant expression by mRNA
Neoplastic PCs in MM showed higher mRNA expression levels for CD52, Kit (CD117) and NCAM (CD56) compared to PCs in MGUS or normal PCs (Figure 2).
Figure 2.
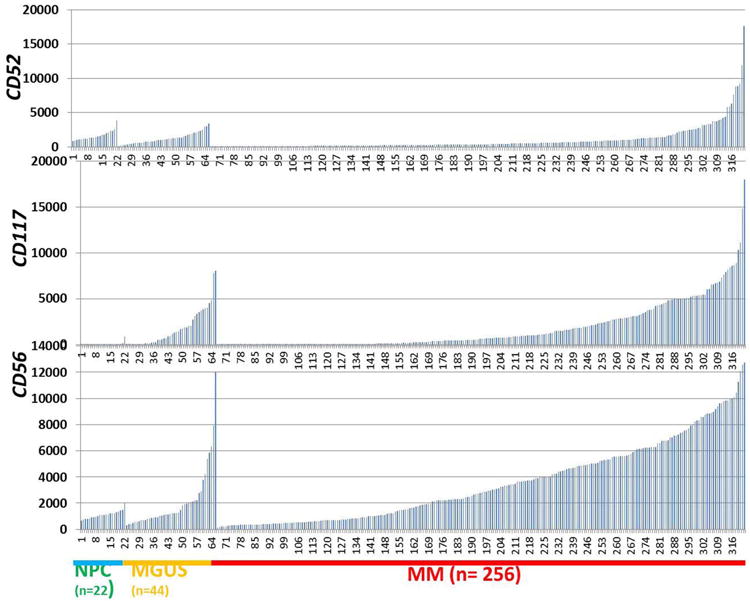
mRNA expression of CD52, CD117 and CD56 in normal plasma cells (NPC), MGUS and MM. GEPs were performed on 22 NPC, 44 MGUS and 256 newly diagnosed MM samples. Signal levels of CD52, CD117 and CD56 are presented on the y-axis and NPC, MGUS and MM samples are shown on the x-axis.
Both CD56 and CD117 antigen expression are positively associated with hyperdiploidy
More HD cases showed positive expression of CD56, CD117 or both by flow cytometry at 69.7%, 40.6%, 27%, compared to NHD cases at 40%, 27.5%, 14.5%, respectively (Figure 3). Furthermore, phenotypic expression of CD56 in HD was positively associated with gain of CCND1 (p < 0.0001), PML (p < 0.0001) and ASS1 (p = 0.0035), representing gain of chromosomes 11, 15 and 9, respectively. In keeping with our flow cytometry findings, high mRNA expression of Kit (CD117) and NCAM (CD56) was evident in the TT2 samples from the HD subgroup (Figure 4). In addition, HD subgroup samples had low expression of CD52 and CD20 (Figure 4). The same pattern was observed in the TT3 samples as well (data not shown).
Figure 3.
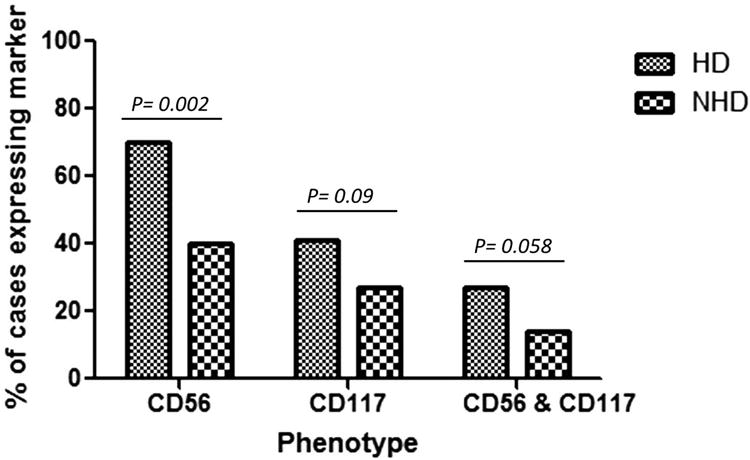
Expression of CD56 and CD117 by flow cytometry on MM plasma cells in HD and NHD subgroups.
Figure 4.
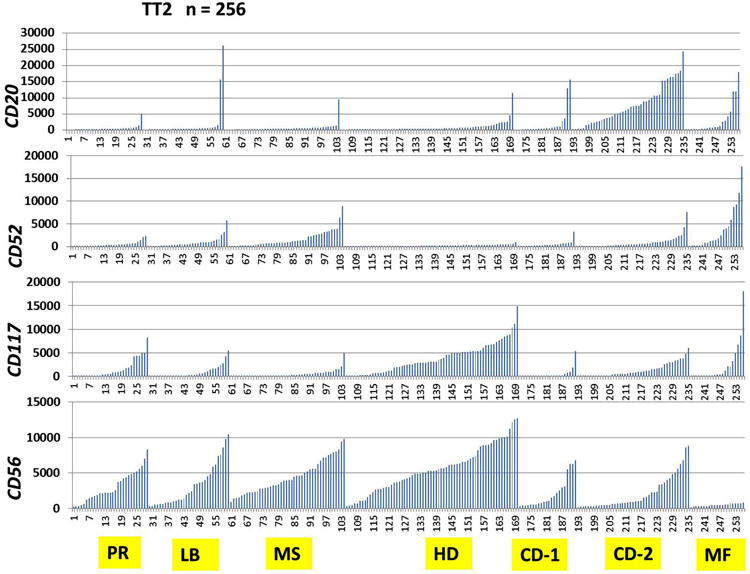
Highly variable mRNA expression of CD20, CD52, CD117 (Kit) and CD56 (NCAM) by GEP in myeloma genetic subgroups. Signal levels of CD20, CD52, CD117 (Kit) and CD56 (NCAM) are shown on the y-axis, and seven multiple myeloma (MM) genetic subgroups from the Total Therapy 2 (TT2) clinical trial are shown on the x-axis. t(14;16)(q32;q23) and t(14;20)(q32;q12) translocations result in activation of c-MAF and MAFB proto-oncogenes, respectively, and were together designated the MF subgroup. Reciprocal t(4;14)(p16;q32) translocation results in hyper-activation of both FGFR3 and MMSET genes, and this group was designated MS. CCND1 and CCND3 were activated by t(11;14)(q13;q32)and t(6;14)(p21;q32) and were designated CD-1 and CD-2, respectively. Hyperdiploid MM subgroup was designated as HD, low bone disease MM subgroup as LB and proliferation MM subgroup as PR.
Subgroups negative for CD56 and/or CD117 positively associate with overall IgH rearrangement
Considering overall IgH rearrangements, expression of CD56 and/or CD117 resulted in a significant negative association with IgH rearrangement (Figure 5 and Table II). Furthermore, when individual IgH partner subgroups were analyzed, approximately half of the CD56-negative samples displayed rearrangement with CCND1, compared to only 14.9% of CD56-positive samples (p < 0.0001). Expression of CD56 was positively associated with FGFR3 rearrangement (11.4% in CD56-positive samples compared to 2.7% in CD56-negative samples, p = 0.03). Unlike CD56, the expression of CD117 did not appear to be associated with any of the individual IgH partners tested (Figure 5).
Figure 5.
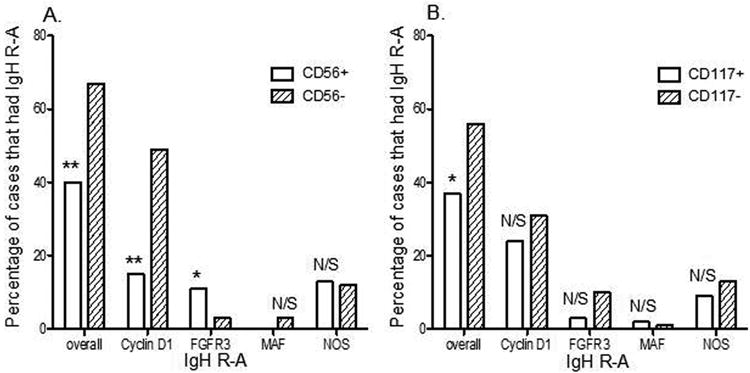
Correlation between IgH rearrangement (IgH R-A) and patterns of CD56 and CD117 antigen expression by flow cytometry on clonal PCs. CD56 (A) and CD117 (B) positive and negative cases were correlated with FISH result for IgH R-A to find statistical significance of differences in overall cases and individual IgH R-A partners (x-axis).
Table 2.
Correlation between IgH rearrangement, and combined CD56 and CD117 expression in PCNs.
| FISH Analysis | Immunophenotype (percentage of cases) | ||
|---|---|---|---|
|
| |||
| CD56+CD117+(n=42) | CD56-CD117-(n=49) | P-value | |
| Overall IgH R-A | 26.2% (11) | 71.4% (35) | <0.0001* |
| IgH R with Cyclin D1 | 14.3% (6) | 55.1% (27) | <0.0001* |
| IgH R with FGFR3 | 4.8% (2) | 4.1% (2) | 0.7 |
| IgH R with MAF | 0 (0) | 2.0% (1) | 0.5 |
| IgH R with NOS | 7.1% (3) | 10.2% (5) | 0.28 |
IgH, immunoglobulin heavy chain; FISH, fluorescence in situ hybridization; MM, multiple myeloma; R-A, rearrangement;
NOS, not otherwise specifi eds.
Significant.
Increased CD52 mRNA expression in both MF and MS subgroups with assorted CD56 and low KIT expression pattern
High CD52 mRNA expression was noted in both the MF (c-MAF and MAFB) and MS (FGFR3 and MMSET) subgroups compared to other MM subgroups, based on common gene expression signatures. The MS subgroup showed characteristically high expression of CD56 mRNA, but lower Kit (CD117) expression. In contrast, the MF subgroup showed high Kit (CD117) expression but lacked NCAM (CD56) mRNA expression. This pattern of mRNA expression for the MF and MS subgroups was consistent in both the TT2 (Figure 4) and the TT3 patient groups.
CD52+ and CD20- is more common in the CKS1B amplification group
Our results indicated that CKS1B copy number positively correlated with the flow cytometric expression of CD52 (p = 0.0258) but less so with CD56 (p = 0.2). However, CKS1B copy number negatively correlated with CD20 (p = 0.0108), as determined from samples with three or more CKS1B signals (Table III). The association between CKS1B mRNA expression level and CD52 or CD20 expression was also confirmed by GEP (Figure 6). Kit (CD117) expression levels were significantly lower in the CKS1B amplified group (p = 0.00003). Similarly, NCAM (CD56) expression trended downward in the CKS1B amplified group, but this did not reach statistical significance (p = 0.078).
Table 3.
Correlation between amplification of CKS1B and antigen expression patterns in PCNs.
| Immunophenotype no. positive cases (percentage, %) | FISH Analysis | ||
|---|---|---|---|
| CKS1B-(n=104) | CKS1B≥3(n=72) | p-value | |
|
|
|||
| CD56 | 55.80% (58) | 65.3% (47) | 0.2 |
| CD52 | 8.7% (9) | 20.8% (15) | 0.0258* |
| CD20 | 26% (27) | 9.7% (7) | 0.0108* |
| CD117 | 40.4% (42) | 29.2% (21) | 0.15 |
FISH, fluorescence in situ hybridization; MM, multiple myeloma.
Significant.
Figure 6.
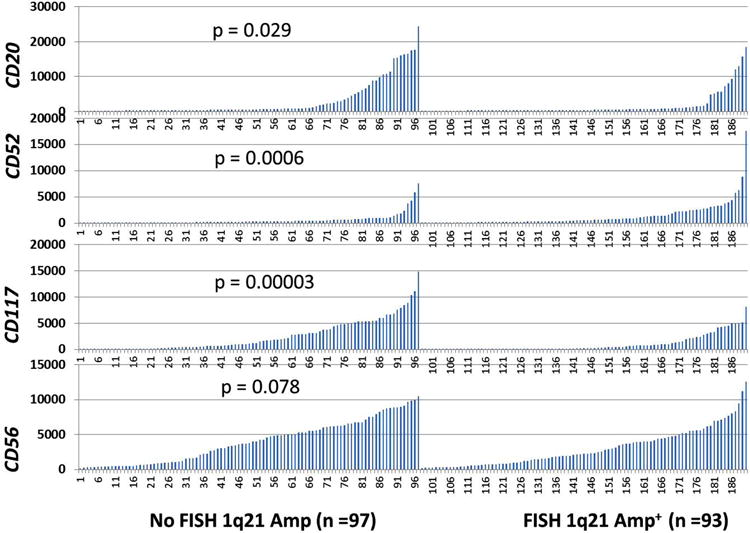
Correlation of phenotypic marker expression with 1q21 amplification. mRNA signal levels of CD20, CD52, CD117 (Kit) and CD56 (NCAM) by GEP are shown on the y-axis. Patients with MM from the TT2 trial with or without 1q21 amplification are shown in groups on the x-axis. Student's t-test was used to compare expression between samples with 1q21 amplification and samples without 1q21 (CKS1B) amplification by FISH.
Discussion
Consistent with what has been reported in the literature, our study mirrored trends of antigen expression frequency in MM. The antigen expression frequency on clonal PCs, in descending order, in our large cohort was: CD56 > CD117 > CD20 > CD52, with CD19 expression only observed in rare cases [2,5,6]. The mRNA expression of CD56, CD52 and CD117 as aberrant markers was increased in MM and MGUS compared to normal PCs (Figure 2).
The present study demonstrated strong association between the expression of CD56 and HD, including gains of CCND1 (chromosome 11), PML (chromosome 15) and ASS1 (chromosome 9). Expression of CD117 also correlated with HD; however, when studied individually, expression of CD117 was associated only with gain of CCND1 but not PML and ASS1 in this cohort. A study by Zingone et al. reported a similar trend between CD56 and CD117 expression and HD as determined by karyotyping [1], but their data were limited by small sample size. The present study extends this observation that applies to gene analysis by locus specific FISH probes on CD138 sorted cells.
In contrast to previous reports [22], we observed different association characteristics between the expression of CD56 and CD117 and IgH rearrangement. Specifically, our study indicated that IgH/CCND was strongly associated with negative CD56 expression. Furthermore, we showed that IgH/CCND1 and IgH/FGFR3 were seen more frequently in CD117-negative MM, although these results are not statistically significant. Additionally, when considering cases with IgH rearrangement, positive CD56 by flow cytometry was associated with IgH/FGFR3. Interestingly, a large majority of these cases were concurrently CD117-negative (11 out of 13 cases: 85%), indicating that the CD56-positive CD117-negative group might indeed represent a novel subgroup with distinctive molecular genetic abnormalities (i.e. IgH/FGFR3 rearrangement). This finding was further reproduced by gene expression profiling in the independent TT2 as well as TT3 patient samples. This phenotype could potentially be proposed for reflex FISH testing to enhance the detection of IgH/FGFR3, which is a poor prognostic abnormality, in a cost-effective manner.
The association of high CD52 expression with MF, MS and CKS1B subgroups that previously were reported to confer a poor outcome [13,17] is another novel finding of this study. In our CKS1B amplified group there was a significant positive association with CD52 (p = 0.0258) but a negative correlation with CD20 (p = 0.0108) by flow cytometry; this was reproducible in independent cohorts by GEP (Figure 6). Higher CD52 expression by GEP was clustered in the group of patients with MAF and FGFR3 (Figure 4) in both TT2 and TT3 populations, with differential expression of CD56 in the latter group. Further analysis of CD52 expression as a target in myeloma may be warranted in patients with MM with gain of CKS1B, or rearrangements involving MAF or FGFR3 loci.
In conclusion, this study sheds light on multiple novel associations between previously defined MM genetic groups and aberrant marker expression patterns. Our findings lend support to the potential use of associated knowledge in a clinical setting to improve MM FISH testing strategies. For example, MAF or FGFR3 reflex FISH testing could be pro- posed for the CD52-positive phenotype, and could improve our detection of cases with these specific abnormalities. These study findings hold significant potential diagnostic and treatment implications in an era of evolving personalized medicine.
Acknowledgments
This work was supported by National Cancer Institute grants R01CA152105 (to F.Z.); the Leukemia Lymphoma Society TRP (to F.Z.); and the National Natural Science Foundation of China, China (no. 81228016 to F.Z.). We would like to thank Susan Schulman for help with manuscript edits.
Footnotes
Potential conflict of interest: Disclosure forms provided by the authors are available with the full text of this article at www.informahealthcare.com/lal.
References
- 1.Zingone A, Kuehl WM. Pathogenesis of monoclonal gammopathy of undetermined significance and progression to multiple myeloma. Semin Hematol. 2011;48:4–12. doi: 10.1053/j.seminhematol.2010.11.003. [DOI] [PMC free article] [PubMed] [Google Scholar]
- 2.Van Riet I, De Waele M, Remels L, et al. Expression of cytoadhesion molecules (CD56, CD54, CD18 and CD29) by myeloma plasma cells. Br J Haematol. 1991;79:421–427. doi: 10.1111/j.1365-2141.1991.tb08050.x. [DOI] [PubMed] [Google Scholar]
- 3.Mateo G, Montalban MA, Vidriales MB, et al. Prognostic value of immunophenotyping in multiple myeloma: a study by the PETHEMA/GEM cooperative study groups on patients uniformly treated with high-dose therapy. J Clin Oncol. 2008;26:2737–2744. doi: 10.1200/JCO.2007.15.4120. [DOI] [PubMed] [Google Scholar]
- 4.Bataille R, Jego G, Robillard N, et al. The phenotype of normal, reactive and malignant plasma cells. Identification of “many and multiple myelomas” and of new targets for myeloma therapy. Haematologica. 2006;91:1234–1240. [PubMed] [Google Scholar]
- 5.Kumar S, Kimlinger T, Morice W, et al. Immunophenotyping in multiple myeloma and related plasma cell disorders. Best Pract Res Clin Haematol. 2010;23:433–451. doi: 10.1016/j.beha.2010.09.002. [DOI] [PMC free article] [PubMed] [Google Scholar]
- 6.Raja KR, Kovarova L, Hajek R, et al. Review of phenotypic markers used in flow cytometric analysis of MGUS and MM, and applicability of flow cytometry in other plasma cell disorders. Br J Haematol. 2010;149:334–351. doi: 10.1111/j.1365-2141.2010.08121.x. [DOI] [PubMed] [Google Scholar]
- 7.Singh C, Yohe S, Baughn L, et al. Utility of flow ctyometry to classify abnormal plasma cell populations in marrow samples collected from patients with putative plasma cell neoplasms. Open J Blood Dis. 2012;2:39–45. [Google Scholar]
- 8.Mateo G, Castellanos M, Rasillo A, et al. Genetic abnormalities and patterns of antigenic expression in multiple myeloma. Clin Cancer Res. 2005;11:3661–3667. doi: 10.1158/1078-0432.CCR-04-1489. [DOI] [PubMed] [Google Scholar]
- 9.Kastrinakis NG, Gorgoulis VG, Foukas PG, et al. Molecular aspects of multiple myeloma. Ann Oncol. 2000;11:1217–1228. doi: 10.1023/a:1008331714186. [DOI] [PubMed] [Google Scholar]
- 10.Debes-Marun CS, Dewald GW, Bryant S, et al. Chromosome abnormalities clustering and its implications for pathogenesis and prognosis in myeloma. Leukemia. 2003;17:427–436. doi: 10.1038/sj.leu.2402797. [DOI] [PubMed] [Google Scholar]
- 11.Sawyer JR. The prognostic significance of cytogenetics and molecular profiling in multiple myeloma. Cancer Genet. 2011;204:3–12. doi: 10.1016/j.cancergencyto.2010.11.002. [DOI] [PubMed] [Google Scholar]
- 12.Zhan F, Hardin J, Kordsmeier B, et al. Global gene expression profiling of multiple myeloma, monoclonal gammopathy of undetermined significance, and normal bone marrow plasma cells. Blood. 2002;99:1745–1757. doi: 10.1182/blood.v99.5.1745. [DOI] [PubMed] [Google Scholar]
- 13.Chang H, Qi X, Jiang A, et al. 1p21 deletions are strongly associated with 1q21 gains and are an independent adverse prognostic factor for the outcome of high-dose chemotherapy in patients with multiple myeloma. Bone Marrow Transplant. 2010;45:117–121. doi: 10.1038/bmt.2009.107. [DOI] [PubMed] [Google Scholar]
- 14.Shi L, Wang S, Zangari M, et al. Over-expression of CKS1B activates both MEK/ERK and JAK/STAT3 signaling pathways and promotes myeloma cell drug-resistance. Oncotarget. 2010;1:22–33. doi: 10.18632/oncotarget.105. [DOI] [PMC free article] [PubMed] [Google Scholar]
- 15.Shetty S, Siady M, Mallempati KC, et al. Utility of a column- free cell sorting system for separation of plasma cells in multiple myeloma FISH testing in clinical laboratories. Int J Hematol. 2012;95:274–281. doi: 10.1007/s12185-012-1021-1. [DOI] [PubMed] [Google Scholar]
- 16.Quinn J, Percy L, Glassford J, et al. CD20-positive multiple myeloma - differential expression of cyclins D1 and D2 suggests a heterogeneous disease. Br J Haematol. 2010;149:156–159. doi: 10.1111/j.1365-2141.2009.08030.x. [DOI] [PubMed] [Google Scholar]
- 17.Zhan F, Huang Y, Colla S, et al. The molecular classification of multiple myeloma. Blood. 2006;108:2020–2028. doi: 10.1182/blood-2005-11-013458. [DOI] [PMC free article] [PubMed] [Google Scholar]
- 18.Xiong W, Wu X, Starnes S, et al. An analysis of the clinical and biologic significance of TP53 loss and the identification of potential novel transcriptional targets of TP53 in multiple myeloma. Blood. 2008;112:4235–4246. doi: 10.1182/blood-2007-10-119123. [DOI] [PMC free article] [PubMed] [Google Scholar]
- 19.Barlogie B, Anaissie E, van Rhee F, et al. Incorporating bortezomib into upfront treatment for multiple myeloma: early results of Total Therapy 3. Br J Haematol. 2007;138:176–185. doi: 10.1111/j.1365-2141.2007.06639.x. [DOI] [PubMed] [Google Scholar]
- 20.Golub TR, Slonim DK, Tamayo P, et al. Molecular classification of cancer: class discovery and class prediction by gene expression monitoring. Science. 1999;286:531–537. doi: 10.1126/science.286.5439.531. [DOI] [PubMed] [Google Scholar]
- 21.Zhan F, Barlogie B, Arzoumanian V, et al. Gene-expression signature of benign monoclonal gammopathy evident in multiple myeloma is linked to good prognosis. Blood. 2007;109:1692–1700. doi: 10.1182/blood-2006-07-037077. [DOI] [PMC free article] [PubMed] [Google Scholar]
- 22.Pozdnyakova O, Morgan EA, Li B, et al. Patterns of expression of CD56 and CD117 on neoplastic plasma cells and association with genetically distinct subtypes of plasma cell myeloma. Leuk Lymphoma. 2012;53:1905–1910. doi: 10.3109/10428194.2012.676174. [DOI] [PubMed] [Google Scholar]


