Fig. 2.

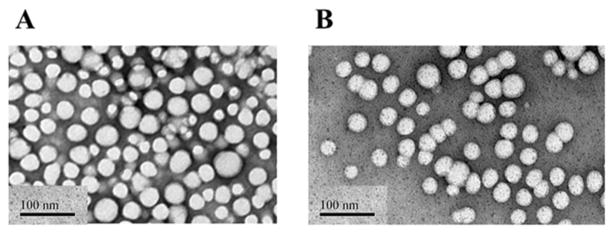
Representative TEM images of NP Wtm (A) and NP olaparib (B). The black scale bar in the left lower corner of each image denotes a distance of 100 nm.

Representative TEM images of NP Wtm (A) and NP olaparib (B). The black scale bar in the left lower corner of each image denotes a distance of 100 nm.