
Figure 2.
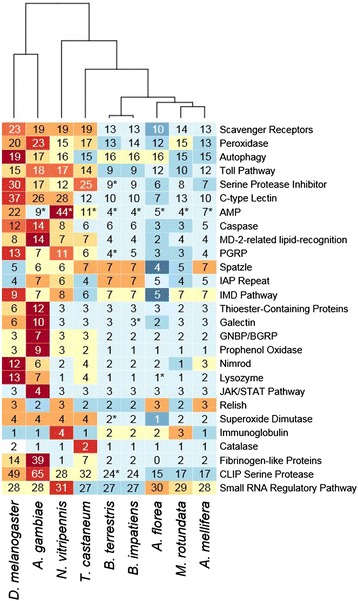
Number of genes belonging to 27 families of immune genes from OrthoDB. The colors in this heatmap reflect the number of genes in that category relative to the other species. Numbers with asterisks were manually adjusted according to our annotation efforts or the literature. The tree represents a clustering analysis using Euclidean distances based on the number of genes within these groups.