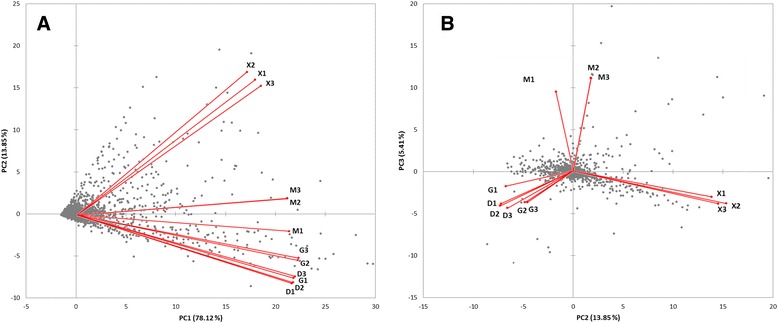
Figure 2.

Principal component analysis (PCA) bi-plots of microarray intensities from the green channel. Red vectors indicate variable (condition) correlation of all analyzed replicates and the grey data points indicate observations (genes). Replicate correlation fits very well already before data normalization. The components one and two (A) and two and three (B) are compared, which explain 78, 14 and 5% of the total variation, respectively. Similar PCA biplots are obtained from microarray intensities of the red channel.
