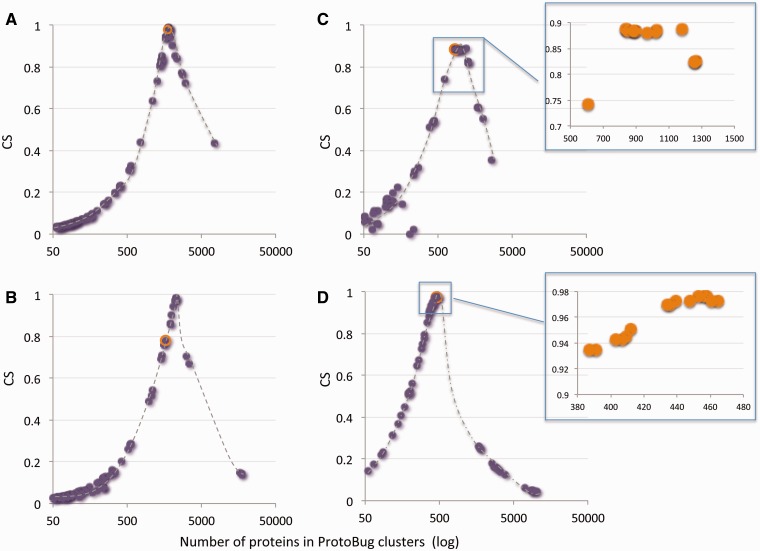
Figure 5.
A keyword-centric view for ProtoBug families according to CS and the number of proteins. Representatives of Pfam keywords are: (A) Cytochrome P450; (B) Ligand-gated ion channel; (C) 7tm odorant receptor; (D) Cadherin domain. Each plot shows the 100 clusters with the highest CSs versus the cluster size (log scale). In most instances the PL70 family and the maximal CS for this keywords coincides (orange symbol in A–D). Insets for C and D show a zoom for the top 15 clusters. For all the keywords, a sharp drop in CS and a substantial increase in the size of the family mark the deterioration in the cluster quality towards the root of the Protobug tree.

