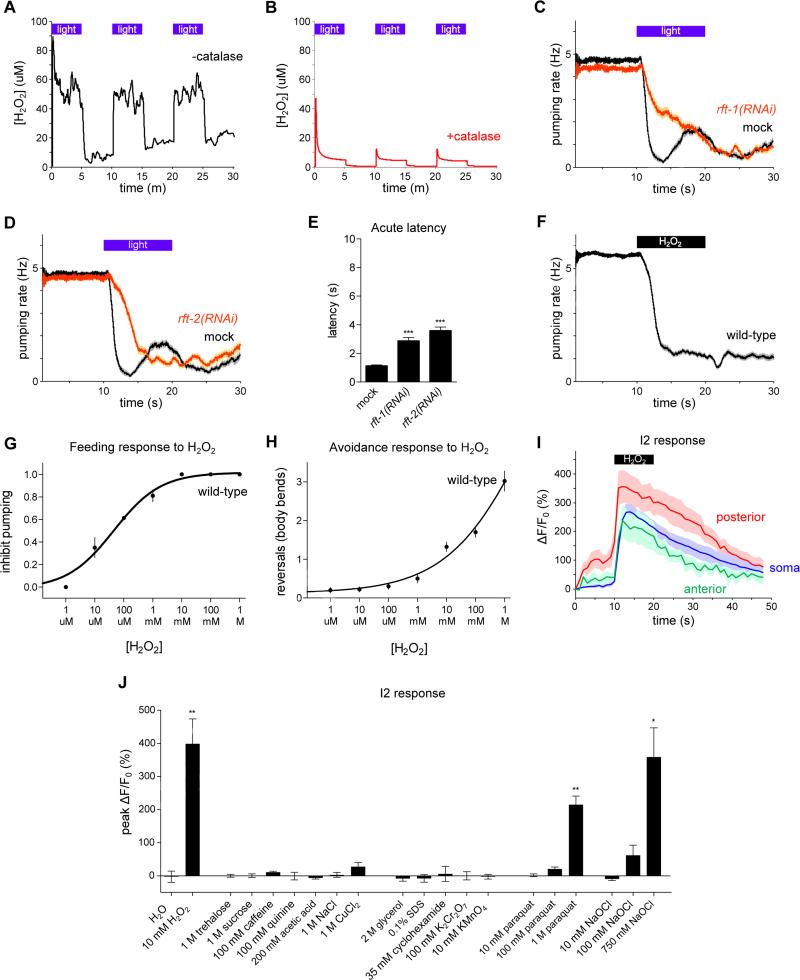
Figure 5. Light can generate hydrogen peroxide and worms respond to hydrogen peroxide.
(A) Light can generate hydrogen peroxide (H2O2) in M9 solution containing riboflavin (50 nM) as measured using a hydrogen peroxide sensor electrode. Three pulses of light, identical in power used to expose worms (436 nm, 13 mW/mm2), are shown.
(B) The generation of H2O2 by light is reduced in a solution containing catalase (1000 U/ml), indicating that the signal measured by the electrode is in fact hydrogen peroxide. Three pulses of light are shown.
(C) RNAi against the riboflavin transporter rft-1 caused a defect in the pumping response to light. n = 60 worms.
(D) RNAi against the riboflavin transporter rft-2 caused a defect in the pumping response to light. n = 60 worms.
(E) Quantification of acute response latency.
(F) Vapor emitted by H2O2 (8.82 M) inhibited feeding by wild-type worms. n = 150 worms.
(G) Fraction of worms that inhibit pumping in response to various concentrations of liquid H2O2. n ≥ 80 worms per data point.
(H) Number of body bends in a reversal in response to various concentrations of liquid H2O2. n ≥ 40 worms per data point.
(I) All three compartments of the I2 neurons responded to H2O2 vapor (8.82 M). n = 10 cells.
(J) Quantification of the I2 calcium response to a panel of compounds dissolved in water. Hydrogen peroxide (10 mM), paraquat (1 M) and sodium hypochlorite (750 mM) activated the I2 neuron, while all other compounds failed to elicit an effect. n = 3 cells.
Shading around traces and error bars indicate s.e.m. * p < 0.05, ** p < 0.01, *** p < 0.001, t-test compared to mock control or water control.
See also Figure S9.

