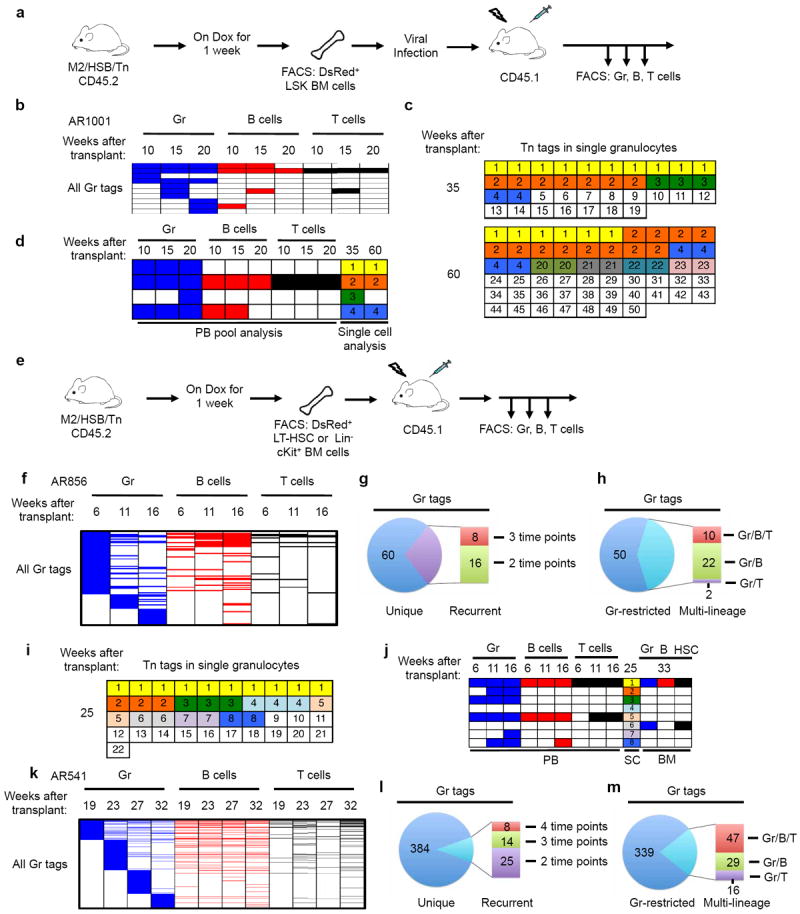
Extended Data Figure 9. Clonal analysis of haematopoiesis under transplantation conditions.

a, Experimental flow chart showing viral infection of donor cells and longitudinal analysis of clonal dynamics in the transplant mouse. 2,000 DsRed+ LSK cells were transduced with retrovirus in the presence of TPO, Flt3 and SCF for 2 days and transferred to lethally irradiated recipients in the presence of 1×10⁵ wild-type bone marrow cells. b, Distribution of PB Gr tags and their presence in B cells and T cells from recipient mouse AR1001 at three time points following transplantation. Tn tags unique to B cells or T cells are not shown. c, Single-cell analysis of PB granulocyte Tn tags from mouse AR1001 at 35 and 60 weeks after transplantation. d, A subset of dominant clones revealed in single-cell analysis (c) are stable in PB. e, Experimental flow chart showing purification and transplantation of LT-HSCs or Lin−cKit+ BM cells from induced M2/HSB/Tn mice. 4 × 10⁴ DsRed+ LT-HSCs or 5×10⁴ DsRed+Lin−cKit+ cells per recipient mouse were used. f–h and k–m, Distribution, recurrence, and lineage potential of PB Gr clones from recipient mouse AR856 receiving LT-HSC donor cells (f–h) and mouse AR541 receiving Lin−cKit+ donor cells (k–m). Data are presented in the same manner as Fig. 2b–d. i, Single-cell analysis of granulocyte Tn tags from mouse AR856 25 weeks after transplantation. j, The dominant clone identified in single-cell (SC) analysis (clone no. 1 in i) is persistently detected in PB and BM from a single femur at 33 weeks. This clone is also detected in the LT-HSC compartment.
