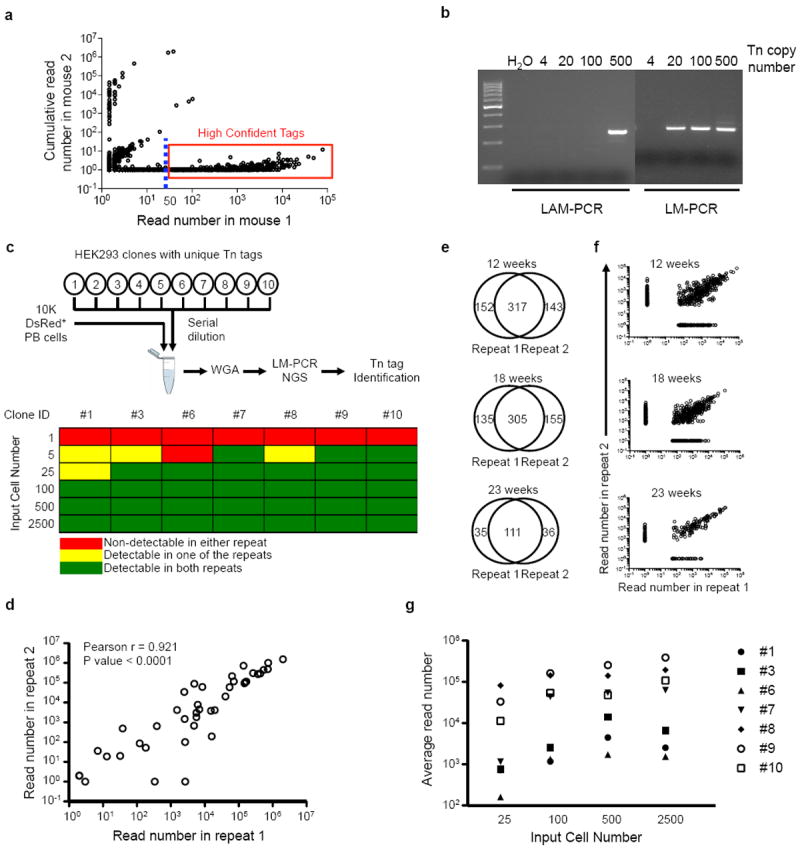
Extended Data Figure 4. Characterization of methodology for Tn tag detection.

a, A representative plot showing read frequencies of Tn tags detected in a test sample (shown on x axis), and their frequencies observed in control samples from an unrelated mouse (shown on y axis). Each circle represents a unique Tn tag. The dashed line depicts 50-read cutoff. Tags in the red box are high-confidence reads selected for further analysis. b, Detection sensitivity of linear amplification-mediated PCR (LAM-PCR) and ligation-mediated PCR (LM-PCR). Serial dilutions of genomic DNA from a transposon mouse are used as input. c, Sensitivity of Tn tag detection from polyclonal samples using LM-PCR. The polyclonal samples are assembled by mixing 10,000 DsRed+ PB cells and different numbers of each of ten HEK293 clones. The Tn tags in these HEK293 clones were pre-determined. Six cell dosages (1, 5, 25, 100, 500 and 2,500 cells) are tested in duplicates for each clone. A positive call for the detection of the known Tn tags is determined based on criteria defined in Supplementary Information. d, Read frequencies between the duplicate samples in c are positively correlated. Each circle depicts a Tn tag from one of the seven HEK293 clones at a particular cell dosage. e, Venn diagram showing additional technical LM-PCR repeats performed on PB Gr split samples of mouse AR1122 collected at 12, 18 and 23 weeks after Dox withdrawal. Shown in plots are the number of Tn tags that are either commonly or uniquely detected in each of the repeats. f, Plots showing read frequencies of Tn tags described in e. g, Broad distribution of read frequencies among different HEK293 clones with same input cell numbers. Averages of the duplicate samples are shown.
