FIGURE 3.
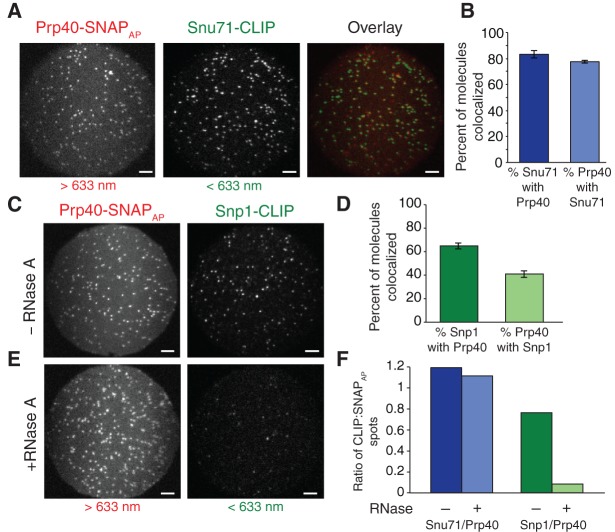
SNAP-SiMPull analysis of U1 snRNP components. (A) Representative microscopic fields of view of U1 snRNP components: Snu71-CLIP and Prp40-SNAPAP. The individual images were false-colored (Snu71-CLIP green and Prp40-SNAPAP red) and superimposed without correction for differences in magnification (overlay). Scale bars are 5 μm. (B) Quantification of colocalization of Snu71-CLIP spots with Prp40-SNAPAP spots (dark blue) and vice versa (light blue) after mapping of the spots between each field of view after correction for differences in magnification. Error was calculated using the standard error of the mean for three replicate experiments. (C) Representative microscopic fields of view between two additional U1 snRNP components, Snp1-CLIP and Prp40-SNAPAP. Scale bars are 5 μm. (D) Quantification of the colocalization between Snp1-CLIP and Prp40-SNAPAP. Error was calculated using the standard error of the mean for three replicate experiments. (E) Representative microscopic fields of view of SNAP-SiMPull of the U1 snRNP components, Snp1-CLIP and Prp40-SNAPAP following extract treatment with 50 µg of RNase A for 30 min at room temperature. (F) Quantification of the colocalization between Snu71/Prp40 and Snp1/Prp40 following RNase treatment of the extract.

