
FIGURE 4.
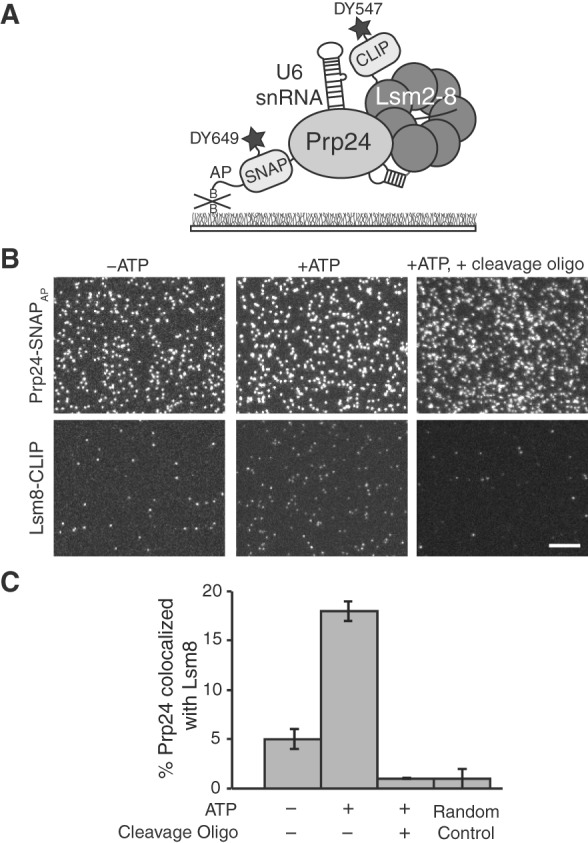
SNAP-SiMPull analysis of U6 snRNP components. (A) Illustration of a SNAP-SiMPull experiment involving colocalization of DY649-labeled Prp24-SNAPAP and DY549-labeled Lsm8-CLIP. (B) Representative microscopic fields of view from a U6 SNAP-SiMPull experiment. Lsm8-CLIP and Prp24-SNAPAP were imaged simultaneously using a dual-view apparatus either in the presence or absence of ATP (left and center) or in the presence of ATP and after RNase H-directed cleavage of the U6 snRNA (right). Scale bar is 10 μm and all images are of identical magnification. (C) Quantification of colocalization of Prp24-SNAPAP and Lsm8-CLIP from fields of view of identical dimensions. ATP causes a large increase in the extent of colocalization, while all colocalization is lost after cleavage of the U6 snRNA. The Random Control bar represents the probability of a Prp24-SNAPAP spot of fluorescence colocalizing with a Lsm8-CLIP spot of fluorescence in the absence of genuine complexes being present. Error bars represent the standard error of the mean derived from three independent experiments.