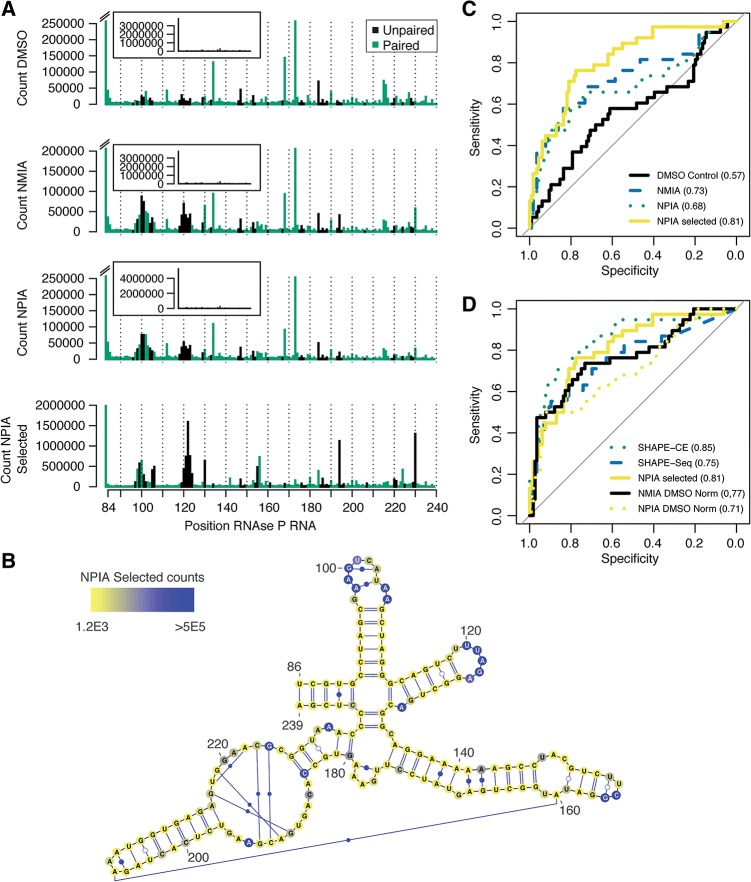
FIGURE 3.
SHAPES probing of RNase P specificity domain RNA. (A) cDNA termination counts for probing of the RNase P specificity domain RNA from the DMSO control sample, NMIA probed sample, NPIA probed sample, and the NPIA probed and selected sample. The coloring of the bars corresponds to the base pair (including noncanonical) annotation of the RNase P RNA as observed in the crystal structure (Krasilnikov et al. 2003), with black being unpaired and green being base-paired. The insets show the plot including the 5′ run-off position for comparison with the selected NPIA sample, where this position is included in the main plot. (B) The base-pairing (both canonical and noncanonical) of the RNase P specificity domain RNA observed in the crystal structure is shown in the figure. Individual positions are colored by their termination count observed in the selected NPIA sample. (C) Receiver-operating characteristic (ROC) curves for the termination counts obtained from the different samples shown in A using the base-pairing information shown in B as the binary classifier. The area under the ROC curve (AUC) for the different samples is indicated in the legend. (D) ROC curves based on the base-pairing information shown in B for the SHAPE reactivities obtained using capillary electrophoresis and DMSO control normalization (SHAPE-CE) (Mortimer and Weeks 2007), SHAPE reactivities obtained using sequencing and DMSO normalization (SHAPE-Seq) (Lucks et al. 2011), the NPIA-selected count obtained in this study, and finally the NMIA and NPIA data obtained in this study normalized with the DMSO data obtained in this study. The area under the ROC curve (AUC) for the different samples is shown in the legend.

