FIGURE 3.
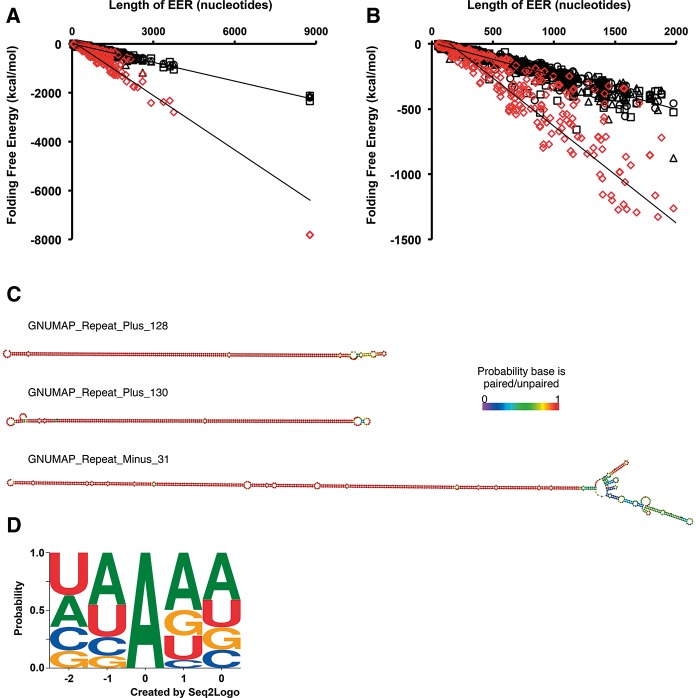
EERs and the editing sites within them bear hallmarks of bona fide ADAR substrates. (A) GNUMAP +Repeat EERs are more stable than random length-matched controls. A comparison of folding free energy (kcal/mol) as a function of EER length is shown for GNUMAP +Repeat EERs (red diamonds) and three sets of randomized regions (black symbols). Folding free energies were calculated using UNAFold (Markham and Zuker 2008) (http://mfold.rna.albany.edu/?q=DINAMelt/software). EERs of all data sets showed a similar trend (Supplemental Table 2). (B) Same data as in A, but zoomed in on EERs ≤2000 nt long. (C) Representative secondary structures of three GNUMAP +Repeat EERs. Coloring as in Figure 2C. (D) The context of GNUMAP +Repeat EER editing sites is consistent with known ADAR site preferences. Editing site logo based on all editing sites found within GNUMAP +Repeat EERs that were ≥1% edited. The contribution of an editing site context to the logo was weighted according to the percentage of reads edited at the site (e.g., a CCAGG with an editing level of 15% would have a contribution of 0.15 to the logo, whereas a GUAGA site editing at 90% would have a contribution of 0.9). The logo was created using Seq2Logo (http://weblogo.threeplusone.com/create.cgi).

