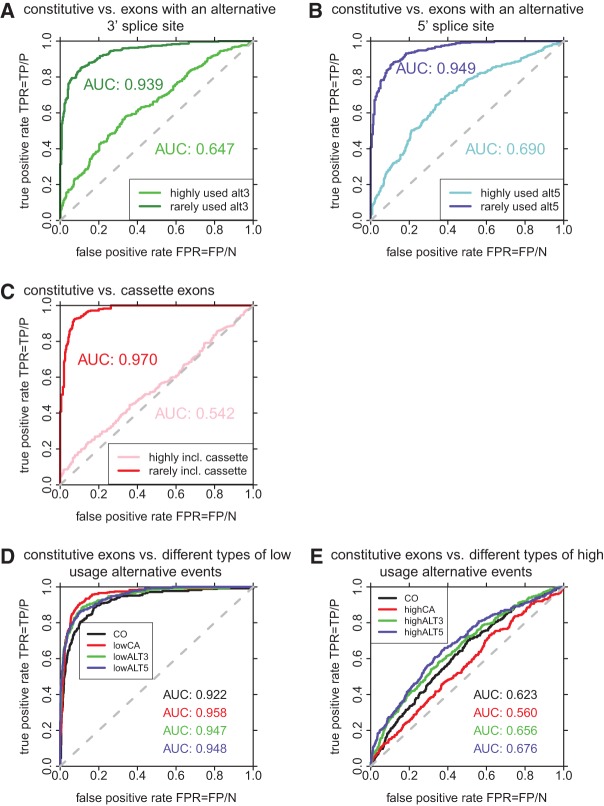
FIGURE 2.
ROC curves of SVMs comparing constitutive exons (CO) and (A) exons with an alternative 3′ splice site, (B) exons with an alternative 5′ splice site, (C) cassette exons, (D) rarely included cassette exons (lowCA), exons with a rarely used alternative 3′ splice site (lowALT3), and exons with a rarely used alternative 5′ splice site (lowALT5), and (E) frequently included cassette exons (highCA), exons with a frequently used alternative 3′ splice site (highALT3), and exons with a frequently used alternative 5′ splice site (highALT5). The true positive rate (TPR) is calculated as the number of true positives (TP) divided by the number of positive (P) samples in the test set. The false positive rate (FPR) is calculated as the number of false positives (FP) divided by the number of negative (N) samples in the test set.

