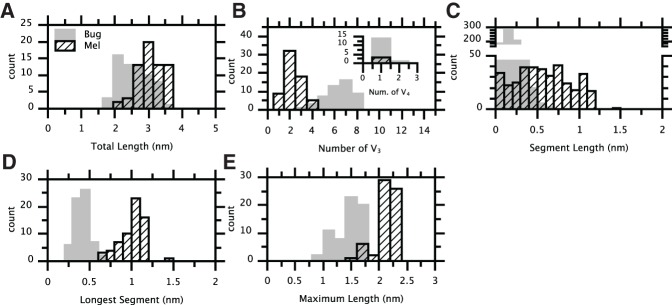
FIGURE 5.

Analysis of the projections shown in Figures 3B and 4B. Values corresponding to Bug are plotted in gray, while those for Mel are plotted in hatched black. (A) The distributions of total length (TL2D). (B) The distributions of the number of apparent three-way branch points (V3) per skeleton; the inset shows the number of apparent four-way branch points (V4). (C) The distributions of segment lengths. Segments are defined as the paths spanning two neighboring branch points or a branch point and its neighboring endpoint. (D) The distributions of the length of each skeleton's longest segment. (E) Maximum projected length (MPL2D) distributions.
