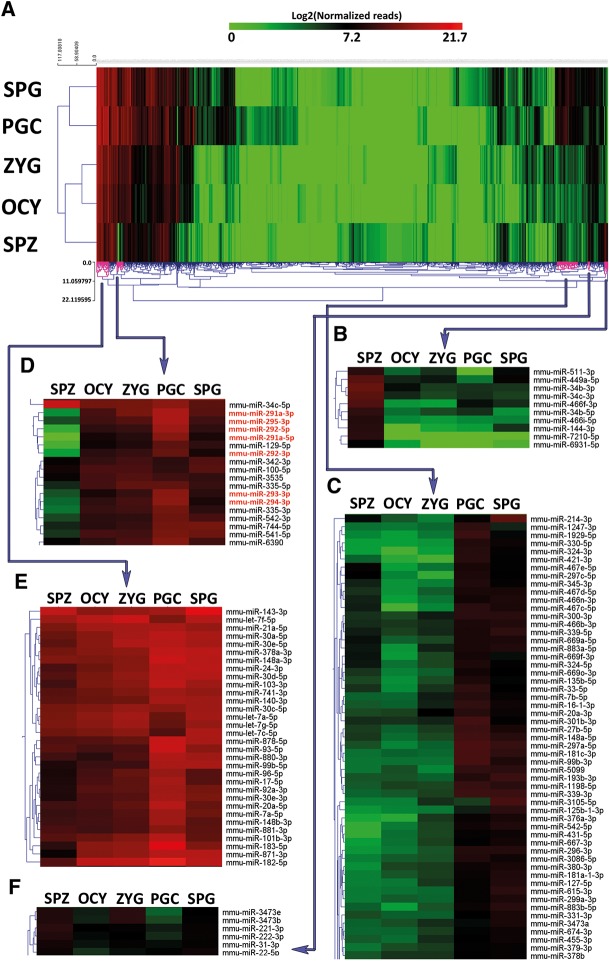
FIGURE 1.
miRNA profiling of male germ cells, oocytes, and zygotes. (A) Heat map with unsupervised hierarchical clustering of miRNA detected in the five cell types studied: primordial germ cells (PGCs), spermatogonia cells (SPG), spermatozoa (SPZ), oocytes (OCY), and zygotes (ZYG). The color scale shown in the map illustrates the relative expression levels (in logarithmic scale) of each miRNA across all samples: Red represents an expression level above the mean; green represents expression lower than the mean. Black represents median expression. (B) Cluster of miRNAs differentially expressed in spermatozoa (SPZ). (C) Cluster of miRNAs differentially expressed in PGC and spermatogonia cells (SPG). (D) Cluster of miRNAs down-regulated in spermatozoa (SPZ). (E) Cluster of miRNAs highly expressed in all cell types. (F) Cluster of miRNAs differentially expressed in spermatozoa (SPZ) and zygotes (ZYG).

