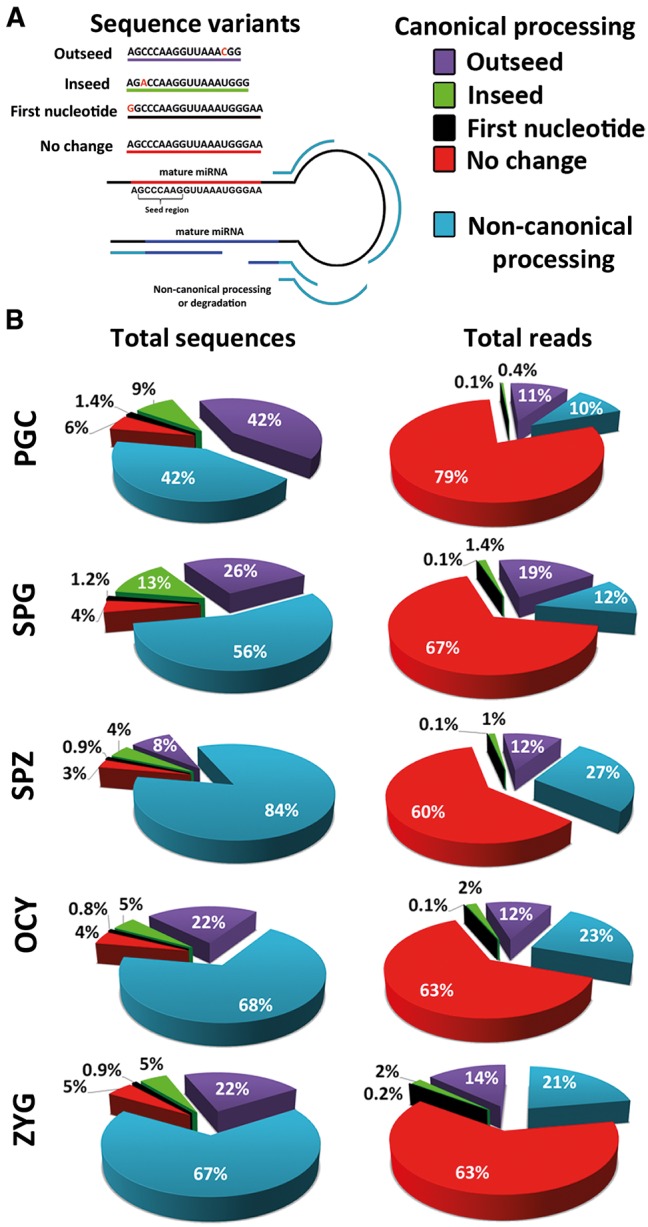
FIGURE 2.

Analysis of miRNA sequence features. (A) The image shows the categories used to classify all the sequences mapped into miRNA precursor molecules. (B) The circular diagrams show the percentage of sequences and reads associated with each sequence feature category.
