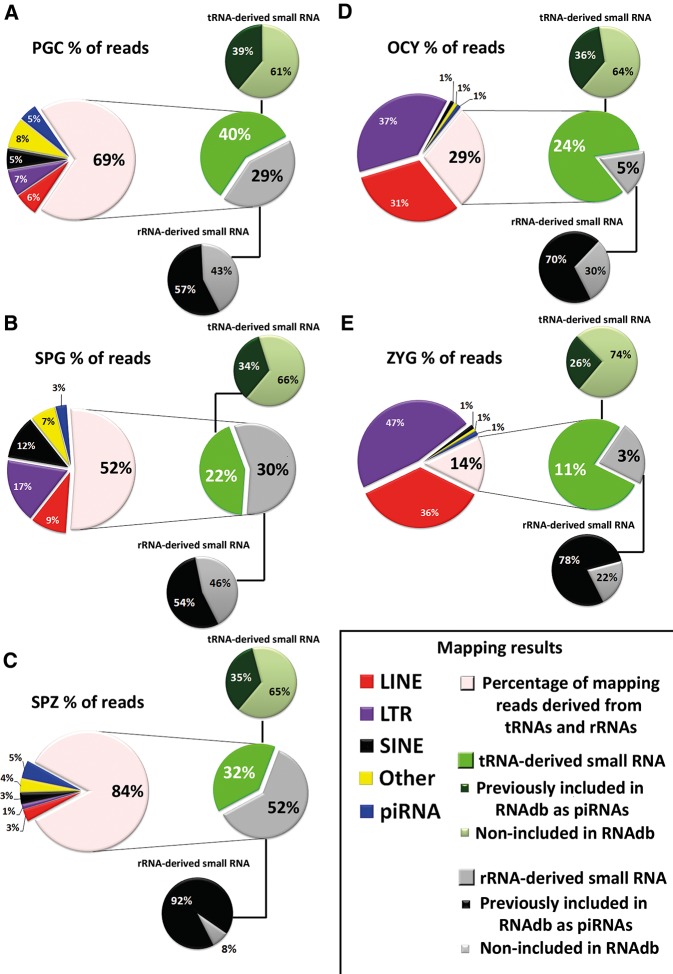
FIGURE 5.
Analysis of rasRNA population. The circular diagrams show the read percentage of rasRNAs associated with different genomic elements. (A–C) Pie charts show the results of rasRNA mapping reads in male germ cells. (D,E) Pie charts show the results of rasRNA mapping reads in oocytes (OCY) and zygotes (ZYG), respectively.

