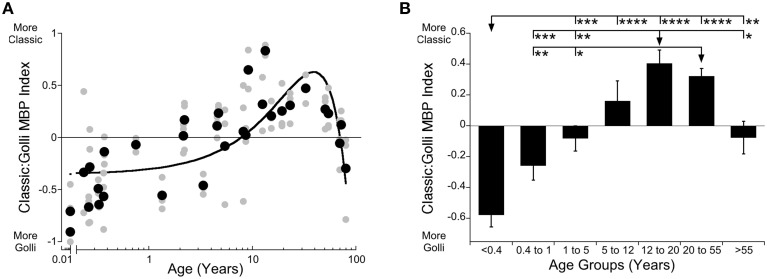
Figure 3.
Developmental changes of Classic- to Golli-MBP Index across the lifespan in human visual cortex. Expression of the index results between Classic- and Golli-MBP are presented in a scatterplot (A), where gray symbols indicate values from individual runs and black symbols indicate values indicate the average between runs. Age is plotted on a logarithmic scale. In a histogram (B), developmental age group means and standard error of the index results in each group are plotted. (A) A quadratic function was fit to all the Classic:Golli index data points (R = 0.653, p < 0.0001), and shows a shift to relatively more Classic-MBP at 7.6 years, shows peak Classic-MBP expression at 38 years (38.3 years, 95% CI ± 2.7 years), and more Golli-MBP at 68 years of age. (B) Significant differences among age groups are identified (ANOVA, F = 16.35, p < 0.0001) and Tukey's post-hoc comparisons were made between groups (*p < 0.05, **p < 0.01, ***p < 0.001, ****p < 0.0001).

