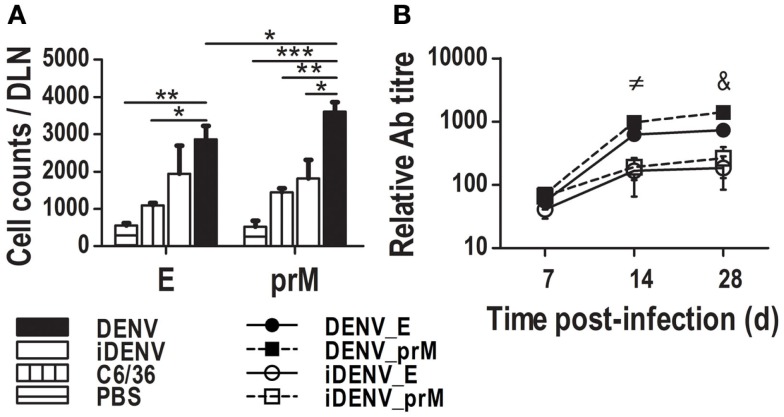
Figure 5.
Specific GC B cells and Ab responses to the viral proteins prM and E. DLN from mice inoculated with different stimuli were harvested at day 14 to prepare cell suspensions. Using multimers made of prM- or E-viral proteins, we searched for Ag-specific GC B cells by flow citometry. (A) Total specific GC B cells per antigenic protein per LN show a higher number for prM-specific GC B cells than for E-specific GC B cells. Data shown are pooled from two independent experiments, represent the mean ± SEM, and were analyzed with two-way ANOVA with the Bonferroni post-test. *P < 0.05, **P < 0.01, ***P < 0.001. (B) Specific (IgG) Ab titers were determined for prM and E viral Ags, DENV induces a bigger quantity of them in comparison with iDENV. Data represent the mean ± SEM of the titers minus the titers of control C6/36, and are representative from two independent experiments. Mice were inoculated at day 0 and boosted at day 7.≠ DENV_E vs iDENV_E, and DENV_E vs iDENV_prM P < 0.05; DENV_prM vs iDENV_E, and DENV_prM vs iDENV_prM P < 0.001 & DENV_E vs iDENV_prM P < 0.05; DENV_E vs iDENV_E P < 0.01; DENV_E vs DENV_prM, DENV_prM vs iDENV_E, and DENV_prM vs iDENV_prM P < 0.001.

