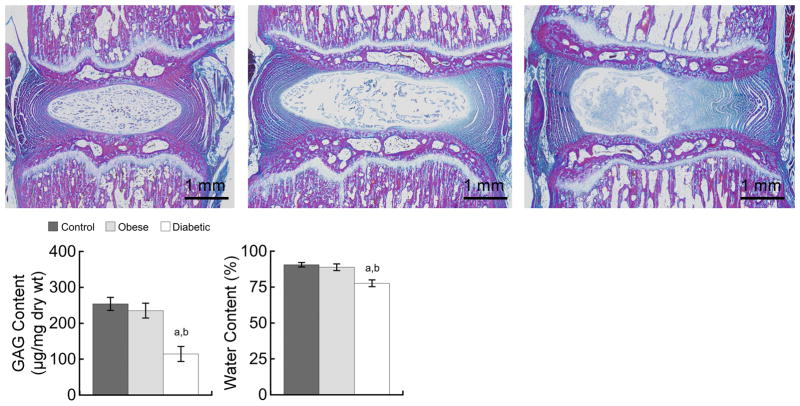
Figure 2.
Top- Mid-coronal histology sections from control (left), obese (center), and diabetic (right). Heidenhain connective tissue stain. Bottom- Effect of diabetes and obesity on GAG content (left) and water content (right) in the nucleus pulposus. Mean ± SEM for n = 6 rats/group; a p < 0.005 vs. control, b p < 0.005 vs. obese.

