
Figure 4.
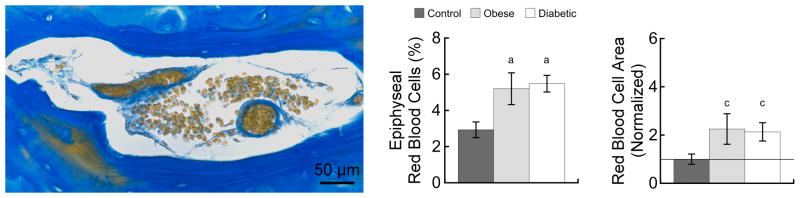
Photomicrograph showing the epiphyseal bone marrow cavity from a diabetic rat (left). Custom stain: RBCs are stained orange; vessel walls and bone matrix are stained blue. Diabetes and obesity significantly increased the percentage of the epiphyseal marrow space occupied by RBCs (center). In absolute terms, diabetes and obesity tended to double the area of RBCs (right; values normalized to the ‘control’ group). Mean ± SEM for n = 4–7 rats/group; a p < 0.05 vs. control; c p < 0.10 vs. control.