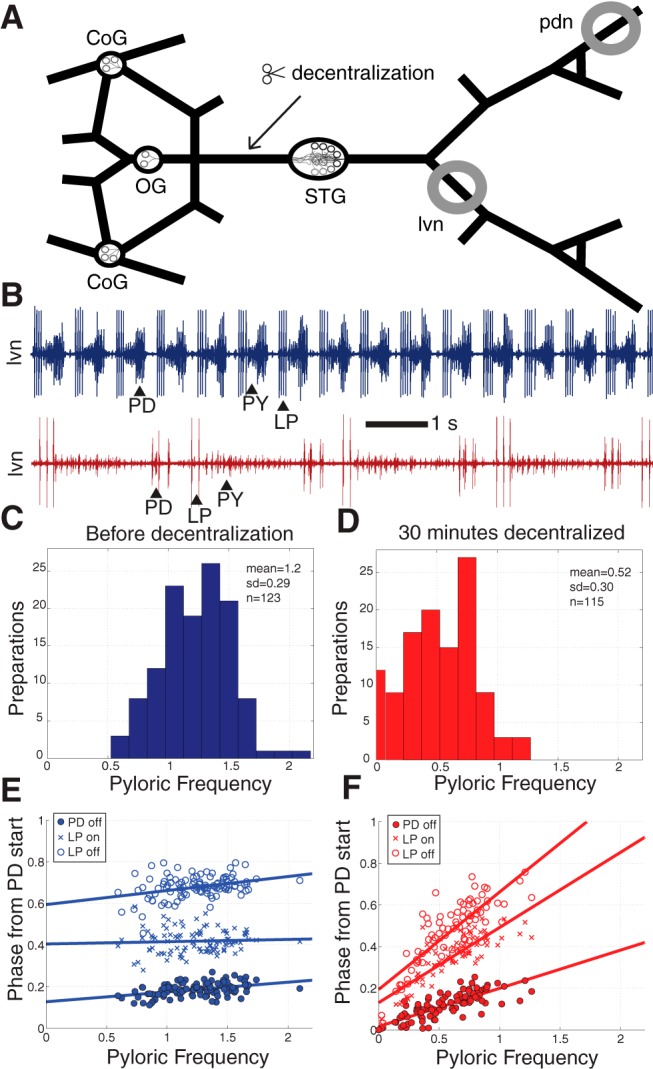
Figure 1.

Acute effects of decentralization on the pyloric rhythm. A, Schematic diagram of the dissected STNS, as pinned out for recording, showing the location of the STG and its associated anterior modulatory ganglia (CoG, OG). Grey circles identify where Vaseline wells were built for monitoring pyloric activity extracellularly. Decentralization was accomplished by blocking or transecting the stn at the indicated location. B, Example lvn recordings from a preparation before (blue trace) and 30 min following decentralization (red trace). C, D, Histograms of pyloric cycle frequencies immediately before decentralization (C, blue bars) and 30 min after (D, red bars). E, F, Phase relationships among the PD and LP cells in the pyloric rhythm for intact (E, blue) and 30 min decentralized (F, red) preparations. Lines represent fits by linear regression.
