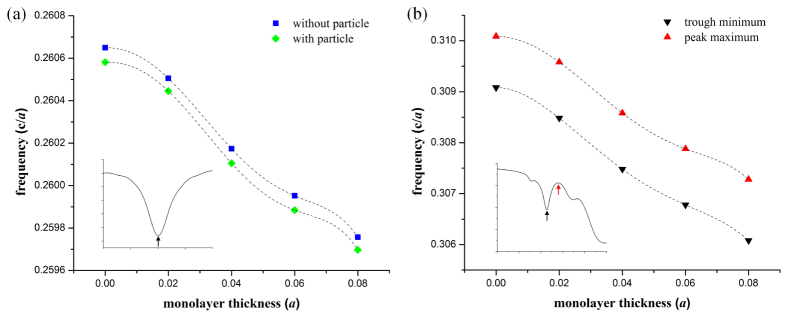
Fig. 4.

Dependence of features in the optical transmission spectrum on infiltration schemes within the slab-PhC sensor. Monolayer thickness and particle infiltration arrangements correspond to the schematic images in Fig. 3(a-d). Arrows on the inset graphs show where minima/maxima are selected. (a) Frequencies for the optical mode localized to the large-hole PhC defect. (b) Frequencies of the trough and peak spectrum features found in the high-frequency transmission band edge. The two features exhibit the same trend; both are shown to demonstrate flexibility in the selection of the band-edge feature. (a,b) Dashed lines indicate polynomial fits to each data set (R2 = 1).
